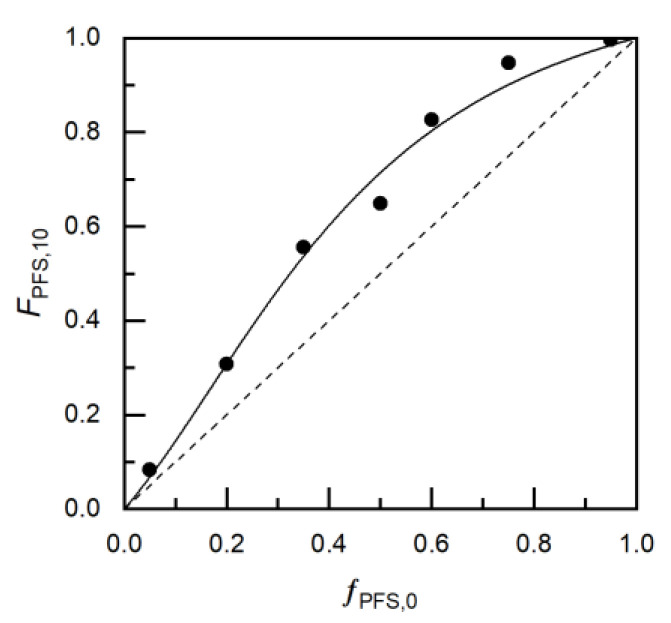
Figure 4.
Mayo-Lewis plot of copolymer composition with respect to 2,3,4,5,6-pentafluorostyrene, FPFS,10, versus monomer feed composition, fPFS,0. The experimental data for MMA/PFS copolymerization is represented by solid circles, while the solid line shows the fit from the reactivity ratios calculated from the non-linear least-square fitting to the Mayo-Lewis equation (rPFS = 3.50 ± 0.70 and rMMA = 0.20 ± 0.21). The straight dashed line indicates the azeotropic composition (fPFS,0 = FPFS). Table 2 lists the experiments used for the plots.

