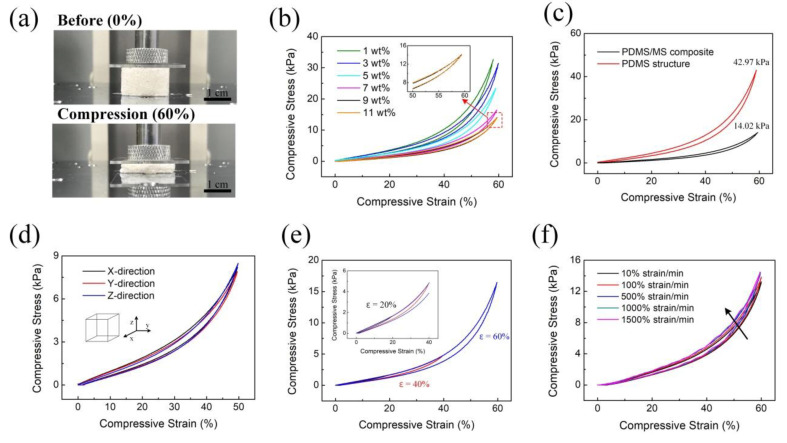
Figure 3.
Mechanical evaluation of the PDMS/MS composite. (a) The compressive schematic of PDMS/MS composite at 60% strain. (b) The measured compressive stress–strain curves according to the concentration of PDMS/MS composite. The curves of 9 and 11 wt.% almost overlap; hence, the 9 wt.% concentration is selected as the maximization point. (c) Comparison of compression characteristics of bare PDMS structure and PDMS/MS composite at 60% strain. (d) The evaluated compressive stress–strain curves with change in compression direction (x, y, z-direction) for investigating the uniformity of MS. (e) The stress–strain curves of PDMS/MS composite with different set strains. (f) Stress–strain curves tested under different strain rates.

