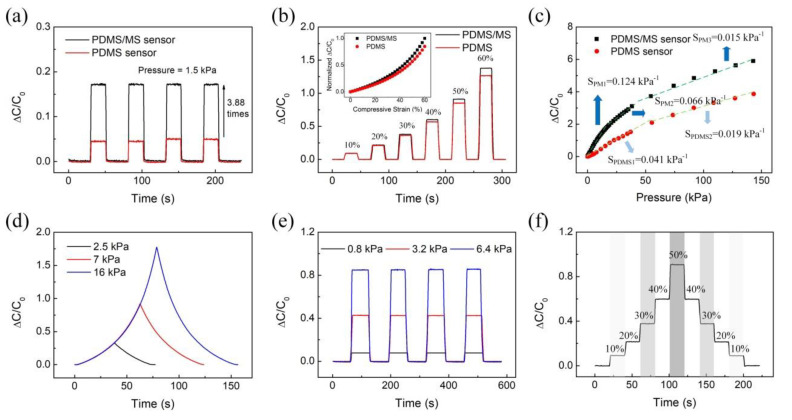
Figure 5.
The measured sensing performance of the capacitive pressure sensor based on the PDMS/MS composite. (a) Comparison of measurement capacitance variation with loading and unloading with time. (b) The capacitance values of PDMS/MS and PDMS sensor with different strain (10~60%). Inset graph shows the analytical calculations. The experimental and analytical calculations show good agreement. (c) Pressure-response curves for sensors based on the PDMS/MS composite and bare PDMS structure. (d) Variation of capacitance of the PDMS/MS composite with same strain rate (10% strain min−1) under different applied stress. (e) Reproducibility test of sponge under different applied stress with time. (f) The measured hysteresis error in consequent loading and unloading steps.

