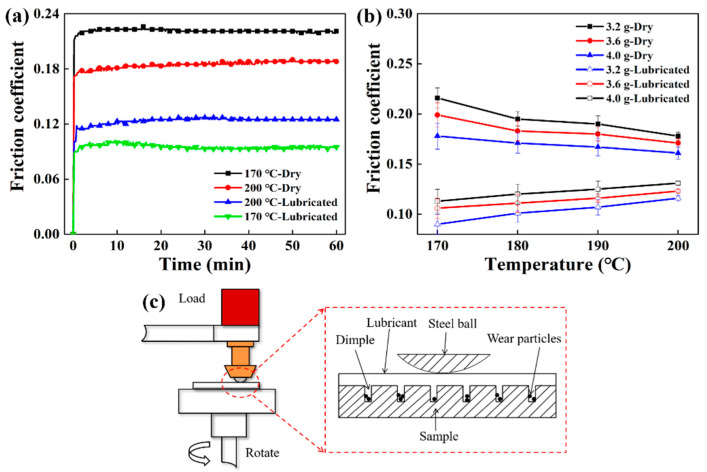
Figure 8.
The friction and wear performance comparison of the samples: (a) The friction curve of the sample under different porosity and working conditions when the charging amount was 3.2 g, (b) coefficient of friction of samples under different porosity and working conditions, and (c) schematic diagram of friction and wear under different working conditions.

