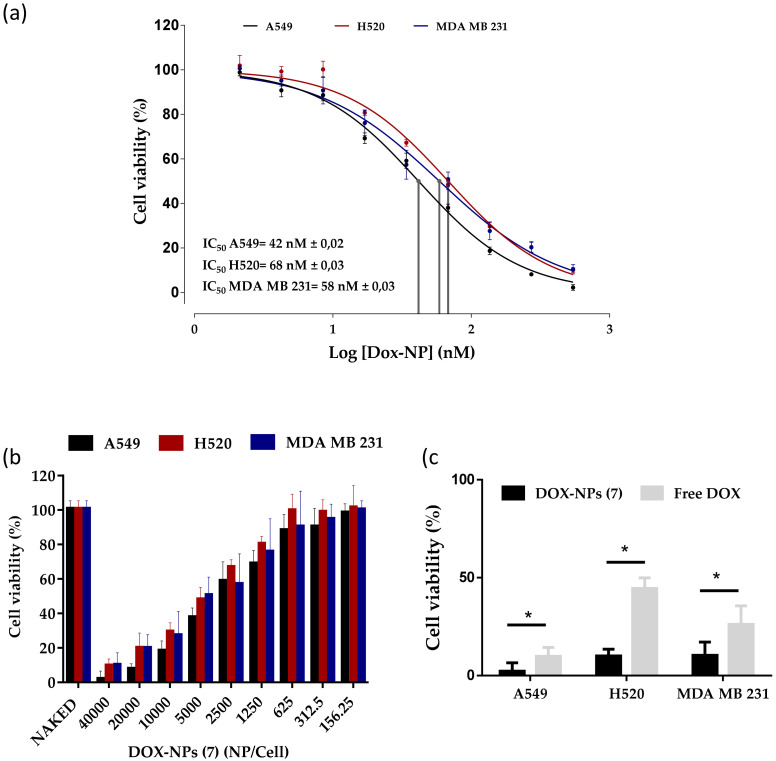
Figure 3.
Effect of DOX-NPs (7) on cell viability. (a) Dose–response curves (percentage of cell viability versus concentration) of the treatment of A549, H520, and MDA-MB-231 cancer cells with DOX-NPs (7) represented in nM. The IC50 value was determined using the logarithm (inhibitor) versus normalized response: variable slope using the GraphPad software. (b) Bar graph showing cell viability of these three cell lines treated with DOX-NPs (7) and NAKED-NPs (1). (c) Comparison of therapeutic effect of DOX-NPs (7) compared to corresponding concentration of free doxorubicin (40,000 NPs/cell, 500 nM). Statistical significance was determined by Student’s t-test (* p-value < 0.0001). The viability data represent the mean ± SEM of the results of three independent experiments with six points each.

