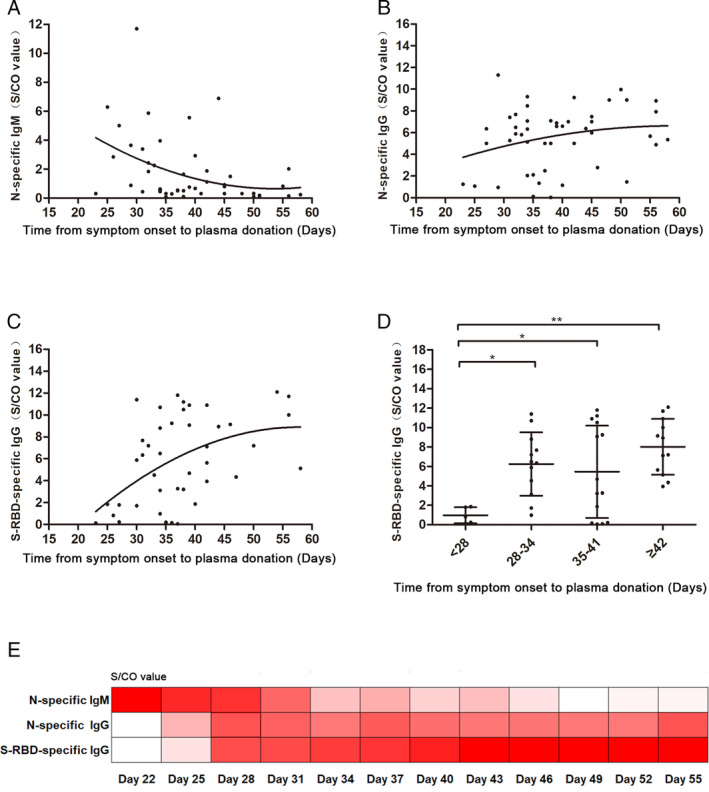
Fig. 1.

Nonlinear regression (curve fit) of SARS‐CoV‐2 antibodies levels. (A) The correlation between the time from disease onset to plasma donation and N‐specific IgM antibody level. There is an inverse correlation (r = −0.3591, p = 0.0056). (B) The correlation between the time from disease onset to plasma donation and N‐specific IgG antibody level. There is a positive correlation (r = 0.2635, p = 0.0352). (C) The correlation between the time from disease onset to plasma donation and S‐RBD‐specific IgG antibody level. There is a positive correlation (r = 0.4540, p = 0.0011). (D) The S‐RBD‐specific IgG antibody level at less than 28 days, 28‐34 days, 35‐41 days, and more than 42 days after disease onset. (E) The level of N‐specific IgM, IgG, and S‐RBD‐specific IgG antibodies during recovery time. The values are presented as the mean ± SD. *p < 0.05, **p < 0.01; NS, nonsignificant. [Color figure can be viewed at wileyonlinelibrary.com]
