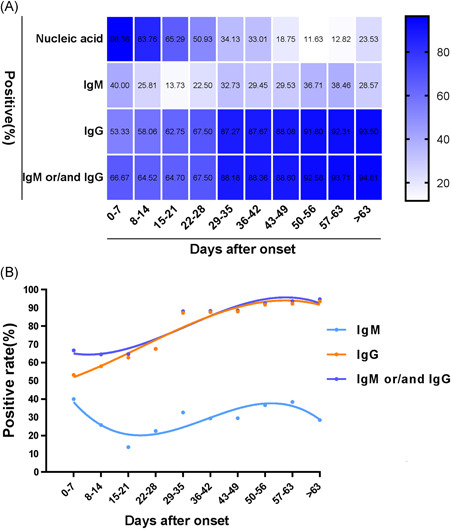
Figure 1.

Dynamic changes in the positive rates in patients after the onset of disease. A, Heat map of changes in the positive rates of antibodies. B, Changes in the positive rates of nucleic acid and antibodies at different time periods after coronavirus disease 2019 onset. IgM, immunoglobulin M
