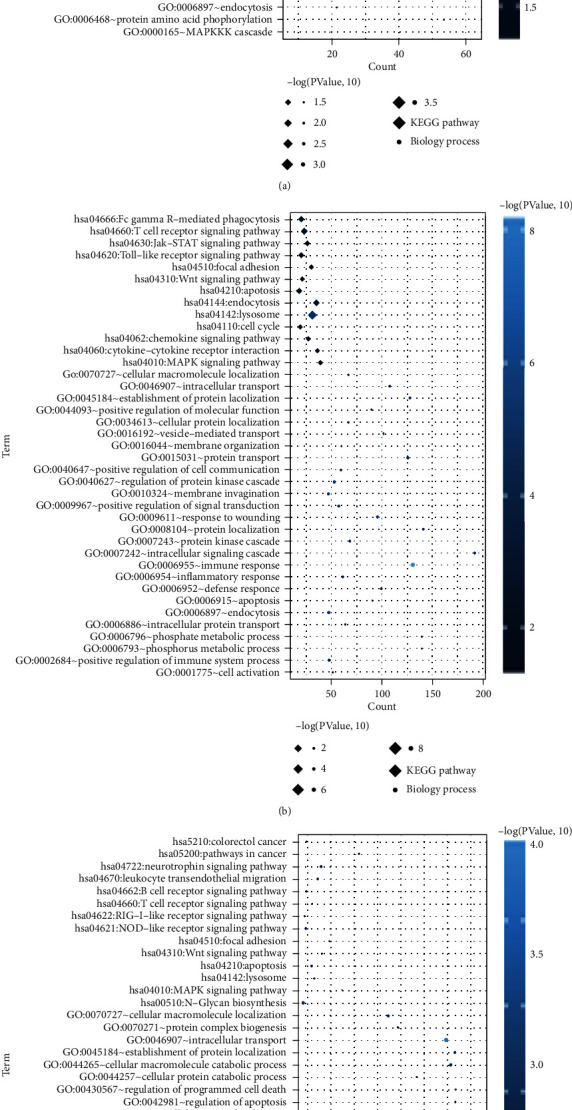
Figure 3.

The DEGs significantly associated with BP and KEGG signaling pathways. The CAD vs. MI without HF group (a). The CAD vs. MI with HF group (b). The MI with HF vs. MI without HF group (c). The horizontal axis represents the number of DEGs, the vertical axis represents the name, the diamond and the circle represent the BP and KEGG paths, respectively, and the color of the dots represents the significant P value, and the darker the color, the higher the significance.
