
Figure 4.
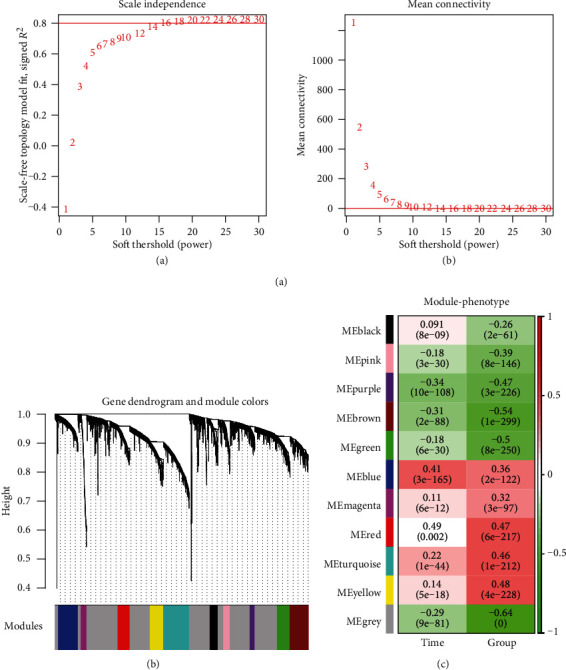
The WGCNA modules. (a, A) Adjacency matrix weight parameter power selection graph. The horizontal axis represents the weight parameter power, and the vertical axis represents the square of the log(k) and log(p(k)) correlation coefficients in the corresponding network. The red line indicates the standard line where the square of the correlation coefficient reaches 0.9. (B) Schematic diagram of the average connectivity of RNA under different power parameters. The red line indicates the value of the average connectivity of the network nodes [1] under the value of the power parameter of the A matrix adjacency matrix. (b) The module divides the tree, each color representing a different module. (c) Correlation heatmap between the module and sample representation.