
Figure 3.
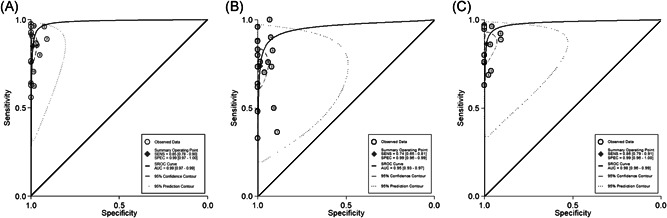
The SROC curves of the serological testing of anti‐SARS‐CoV‐2 antibodies. The regression SROC curve indicates the overall diagnostic accuracy. (a) IgG, (b) IgM, (c) IgG or IgM. AUC, area under the curve; IgG, immunoglobulin G; IgM, immunoglobulin M; SENS, sensitivity; SPEC, specificity; SROC, summary receiver operator curve