
Figure 1.
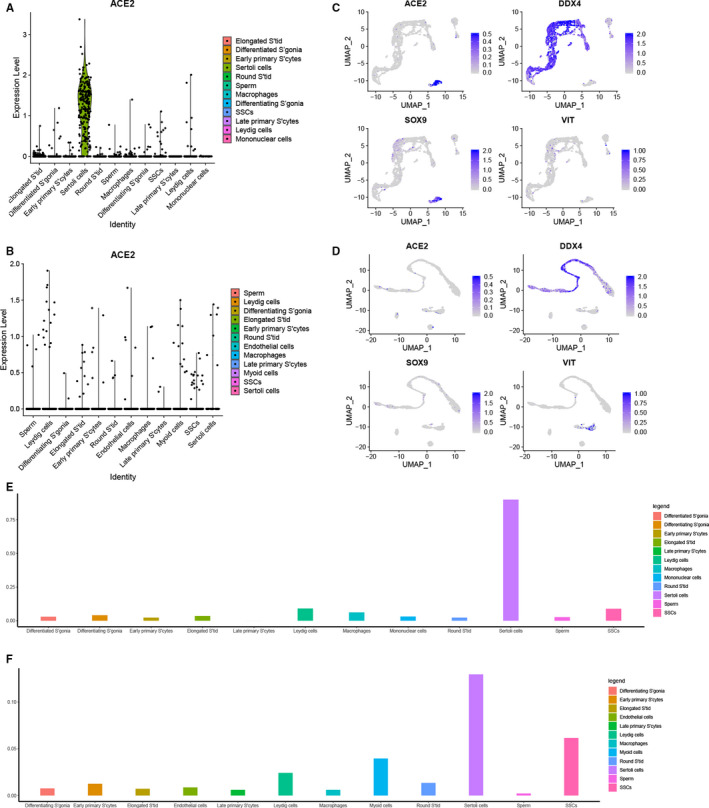
scRNA‐seq analysis of ACE2 in human testicular cells. A, Expression patterns (violin plot) showing the mRNA expression of ACE2 in the 12 clusters of the mid‐aged. The Sertoli cells are the highest positive cluster. B, The violin plot of mRNA expression of ACE2 across all cell types of the young group. C, UMAP plot showing the mRNA expression ACE2 across clusters of mid‐aged. The Sertoli cells (SOX9) are the highest ACE2‐positive cells, SSCs with the highest ACE2 positive rate in Germ cells (DDX4), and some Leydig cells (VIT) are positive. D, In young group, the ACE2‐positive cells shown in the Germ cells, Sertoli cells and Leydig cells. E, The percentage of ACE2‐positive cells in different type cells in mid‐aged, Sertoli cells with the highest positive cluster (over 90%). F, Sertoli cells are the highest cluster with ACE2‐positive cells in the young group