Figure 2.
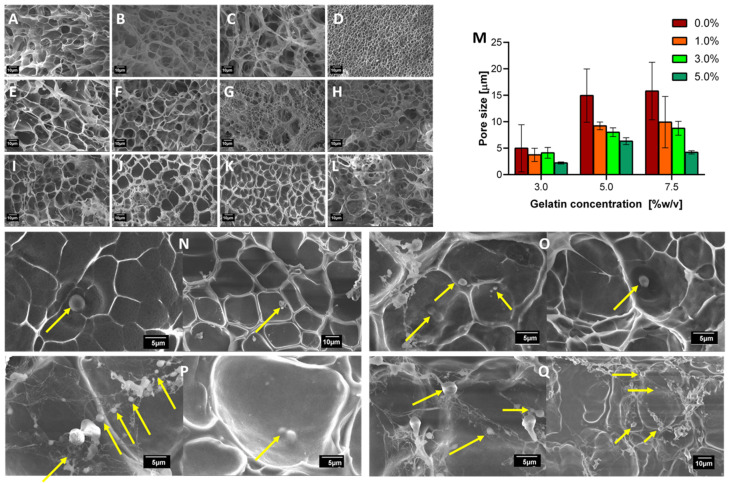
Surface morphology described by scanning electron microscope (SEM) micrographs of crosslinked and uncrosslinked hydrogels in the presence and absence of yeast cells. First row is for 3.0% (w/v) gelatin concentration and varying GTA concentrations from 0.0% (A), 1.0% (B), 3.0% (C) to 5.0% (w/w) (D). Second row is for 5.0% (w/v) gelatin concentration and varying GTA concentrations from 0.0% (E), 1.0% (F), 3.0% (G) to 5.0% (w/w) (H). Finally, 7.5% (w/v) gelatin concentration and varying GTA concentrations from 0.0% (I), 1.0% (J), 3.0% (K) to 5.0% (w/w) (L). (M) Average pore size for all treatments. 7.5% (w/v) gelatin, 3.0% (N) and 5.0% (P) (w/w) GTA hydrogel, before bioreactor operation. Moreover, micrographs after 72 h bioreactor operation are presented for 3.0% (O) and 5.0% (Q) (w/w). The yellow arrows point to dehydrated K. lactis cells compartmentalized into the gel pores.

