
FIGURE 2.
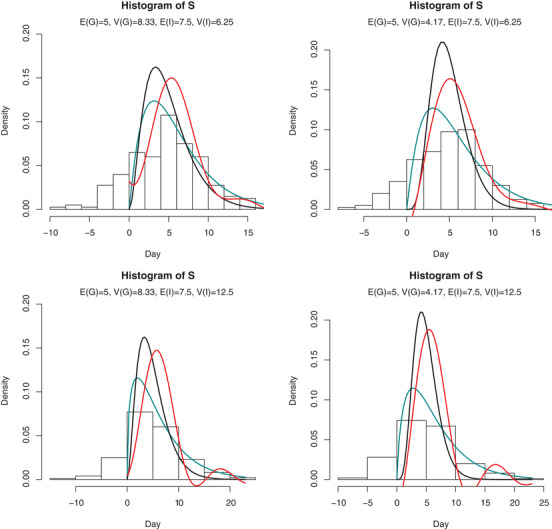
Histogram of serial interval data and density of generation time in simulation Note. The expectation and variance of generation time and incubation period are listed in each subfigure. Black line: true density; cyan line: Gamma fit of S by deleting negative observations; red line: estimated density. This figure appears in color in the electronic version of this paper, and any mention of color refers to that version.