
FIGURE 3.
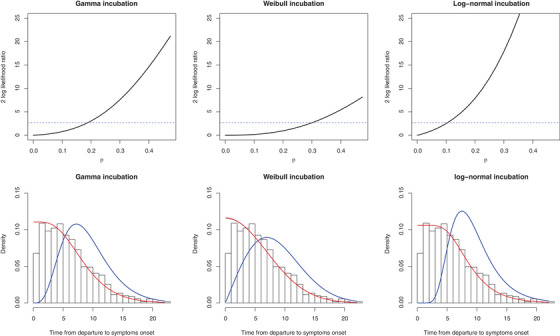
COVID‐19 data analysis result Note. Upper: twice of log‐likelihood ratio, , versus π. The dashed line is at 2.71, the 90% quantile of chi‐squared distribution with 1 degree of freedom. In fact, the horizontal ordinate of the crossover point is the 95% upper bound of π by likelihood ratio, since (mixed chi‐squared distribution), where is the cdf of chi‐squared distribution with 1 degree of freedom. Lower: incubation estimation; red line: forward time fit; blue line: incubation period fit; black line: mixed observed time fit (covered by the red line). This figure appears in color in the electronic version of this paper, and any mention of color refers to that version.