
Figure 3.
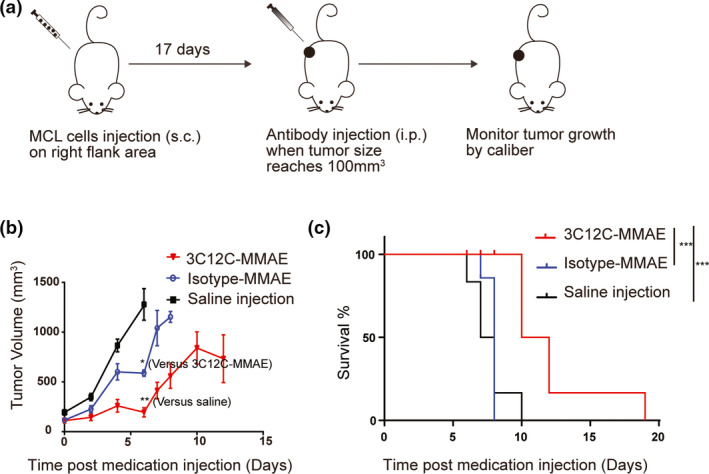
CD83 ADC kills MCL in xenograft mice. (a) Schematic design of the MCL xenograft NSG mouse model. (b) Quantification of tumor volume from MCL engrafted mice treated with 3C12C‐MMAE, isotype control‐MMAE or saline was shown (n = 6 mice per group). One of three representative experiments is shown. (c) Kaplan–Meier survival curves of mice implanted with Mino cells (n = 6 mice per group). Data were analysed with a log‐rank test. ***P < 0.001. One of three representative experiments is shown.