
Figure 4.
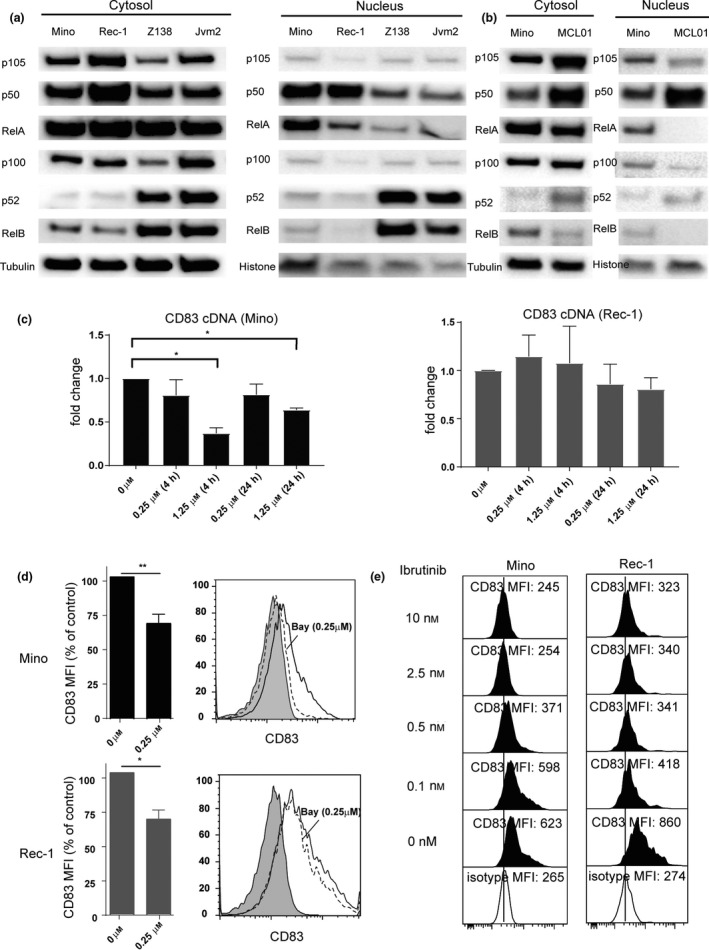
Activation of NF‐κB increases CD83 expression in MCL. (a) Western blot analysis of canonical pathway NF‐κB protein (p105/p50 and RelA) and non‐canonical pathway NF‐κB protein (p100/p52 and RelB) levels in the cytosolic and nuclear extracts of CD83+ MCL cells (Mino and Rec‐1) and CD83‐ MCL cells (Z138 and Jvm2). (b) Western blot analysis of canonical NF‐κB protein (p105/p50 and RelA) and non‐canonical NF‐κB protein (p100/p52 and RelB) levels in the cytosolic and nuclear extracts of CD83+ MCL cells (Mino) and primary MCL cells (MCL01). (c) CD83+ cells were treated with either a DMSO control or canonical NF‐κB inhibitor BAY‐11‐7082 at different concentrations (0.25 or 1.25 µm) for 4 or 24 h. Real‐time PCR (qPCR) analyses of CD83 cDNA from Mino (left) and Rec‐1 (right) cells are shown. *P < 0.05. (d) CD83+ cells were treated with either a DMSO control or BAY‐11‐7082 (0.25 µm) for 24 h. Cell surface CD83 expression on Mino (upper) and Rec‐1 (bottom) was analysed by flow cytometry, and mean fluorescence intensity (MFI) normalised to the untreated samples is shown (n = 3). *P < 0.05; **P < 0.01. Data from one representative experiment are shown in right panel. Filled histogram: isotype control. Open histogram with solid line: CD83 staining on cells treated with DMSO. Open histogram with dash lines: cells treated with BAY‐11‐7082 (0.25 µm). (e) Mino cells or Rec‐1 cells were cultured in the different concentration of ibrutinib for 72 h, CD83 expression was analysed by flow cytometry with human anti‐CD83 antibody 3C12C‐FITC, and mean fluorescent intensity of one representative experiment (n = 3) is shown.