
Fig. 1 |. Global view of chromatin states during gastrulation in mouse embryos.
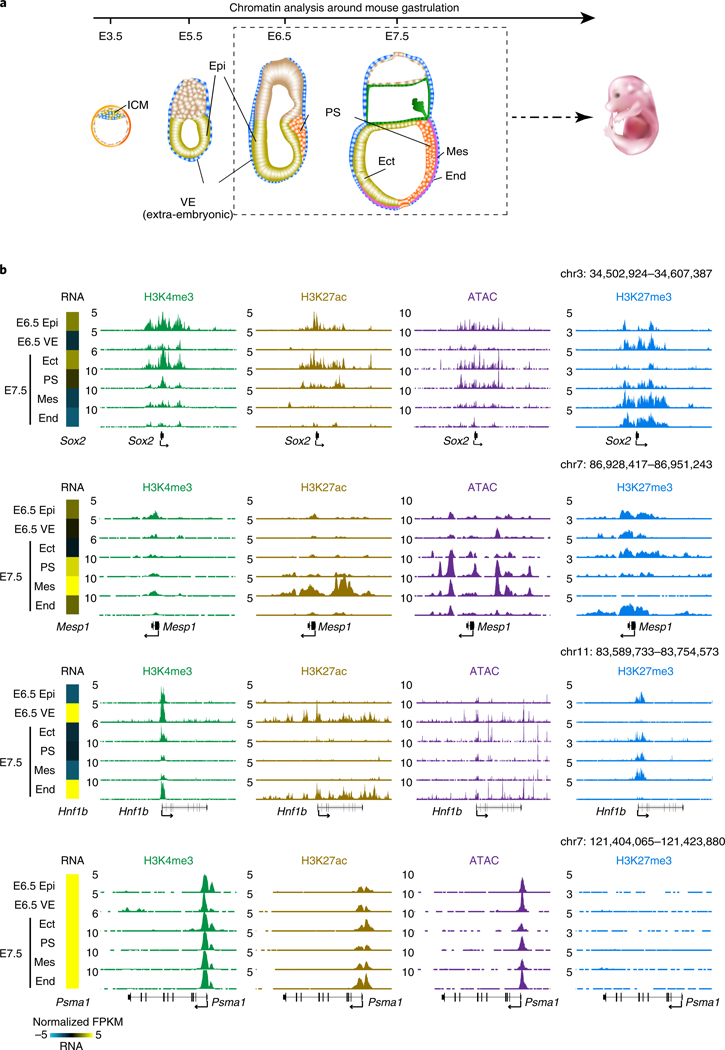
a, A schematic showing the overview of peri- to post-implantation embryonic development. Dashed box indicates isolated lineages in this study for chromatin analysis, including Epi (E6.5), VE (E6.5), Ect (E7.5), PS (E7.5), Mes (E7.5) and End (E7.5). b, Snapshots of UCSC genome browser showing the distributions of histone modifications (n = 2) and chromatin accessibility (n = 2) near lineage-specific marker genes. Gene expression34 is also displayed in heatmaps (log2 FPKM). The genome browser view scales were adjusted on the basis of the global data range.