
Extended Data Fig. 4 |. Bivalency states in E6.5Epi and E6.5VE.
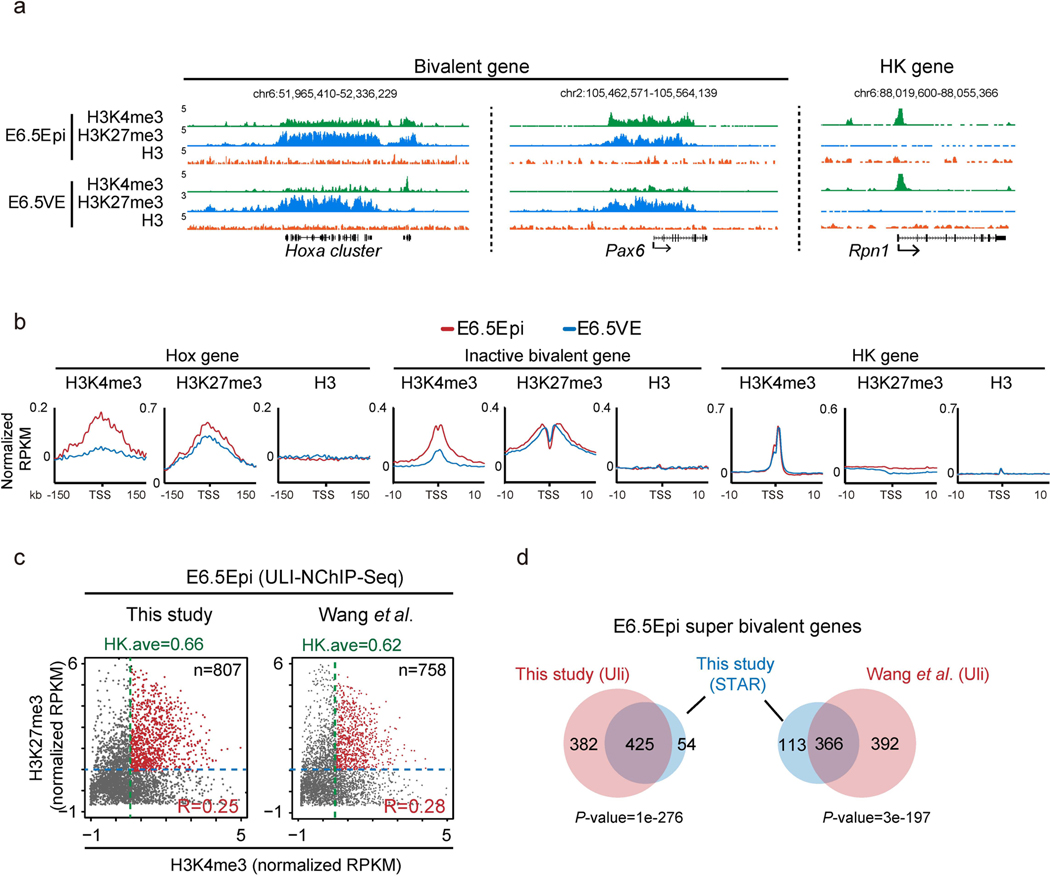
a, The UCSC genome browser views showing the enrichment of H3K4me3 (n=2), H3K27me3 (n=2) and H3 (n=1) at developmental genes Hoxa cluster, Pax6, as well as a housekeeping gene Rpn1 in mouse E6.5Epi and E6.5VE. b, Average plots showing H3K4me3 (n=2), H3K27me3 (n=2) and H3 (n=1) enrichment at the Hox gene cluster, inactive bivalent genes (inactive in E6.5Epi and E6.5VE), and housekeeping genes in E6.5Epi and E6.5VE. c, The scatter plot showing the enrichment of H3K4me3 (ULI-NChlP-seq), either done in this study (left) or in a previous study50 (right), and H3K27me3 (STAR ChlP-seq) of all bivalent genes (n=3,992) for E6.5 epiblast. The average H3K4me3 enrichment of housekeeping gene (HK.ave) is shown for each tissue. The number of super bivalent genes (top right) and Pearson correlation of H3K4me3 and H3K27me3 for each tissue (bottom right) are shown. d, The Venn diagram shows the overlap of super bivalent genes identified by ULI-NChlP-seq (Uli) and STAR ChIP-seq in E6.5 epiblast. The P-values was calculated by Fisher’s test.