
Extended Data Fig. 6 |. Loss of super bivalent H3K4me3 is associated with aberrant developmental gene activation.
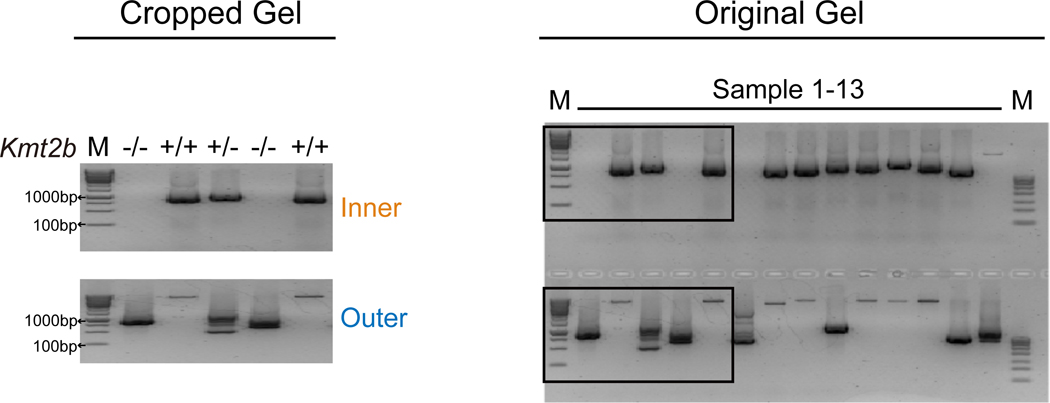
a, Gene expression of Kmt2b in pre- and post-implantation embryos is shown as bar graphs using previously published datasets28,34. b, Left, a schematic showing Kmt2b knockout strategy using Cas9/CRISPR as previously described61. Inner and outer primers for genotyping are shown. Right, the genotyping results of identified wild-type and Kmt2b−/− embryos using extra-embryonic tissues at E6.5. One representative image from three independent experiments is shown. Uncropped gel is also shown in Source data. M, DNA ladder; +/+, wild-type; +/−, heterozygote; −/−, homozygote. c, Average plots showing H3K4me3 enrichment at super bivalent/non-super bivalent/housekeeping genes (defined in E6.5 epiblast) for wild-type (n=2) and Kmt2b−/− E6.5Epi (n=3) and E8.5 head (n=2). The H3K4me3 enrichment is normalized against H3K4me3 signals at housekeeping (HK) gene promoters for each lineage. d, The morphology of wild-type and Kmt2b KO embryos from E6.5 to E9.5. Three independent experiments were performed. e, Hierarchical clustering based on gene expression in wild-type and Kmt2b KO embryos from E6.5 to E9.5. Arrow indicates E9.5 Kmt2b−/− embryo.