
Extended Data Fig. 7 |. WT vs. Tet1/2 DKO embryos in E6.5 epiblasts.
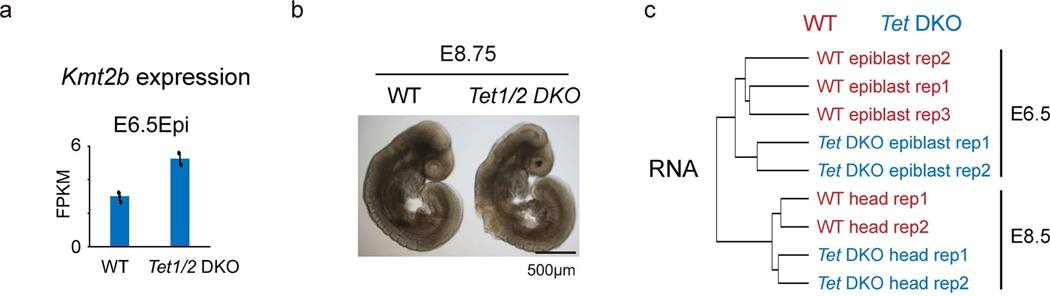
a, Bar chart showing the expression levels of Kmt2b in wild-type (n=3) and Tet1/2 DKO (n=2) E6.5 epiblasts. The error bar represents the S.D with the barplot showing the the mean value. b, The morphology of wild type and Tet1/2 DKO embryos at E8.75. Two independent experiments were performed. c, Hierarchical clustering based on gene expression in wild-type and Tet1/2 DKO embryos from E6.5 to E8.5.