
Extended Data Fig. 9 |. Super bivalent genes show strong spatial clustering.
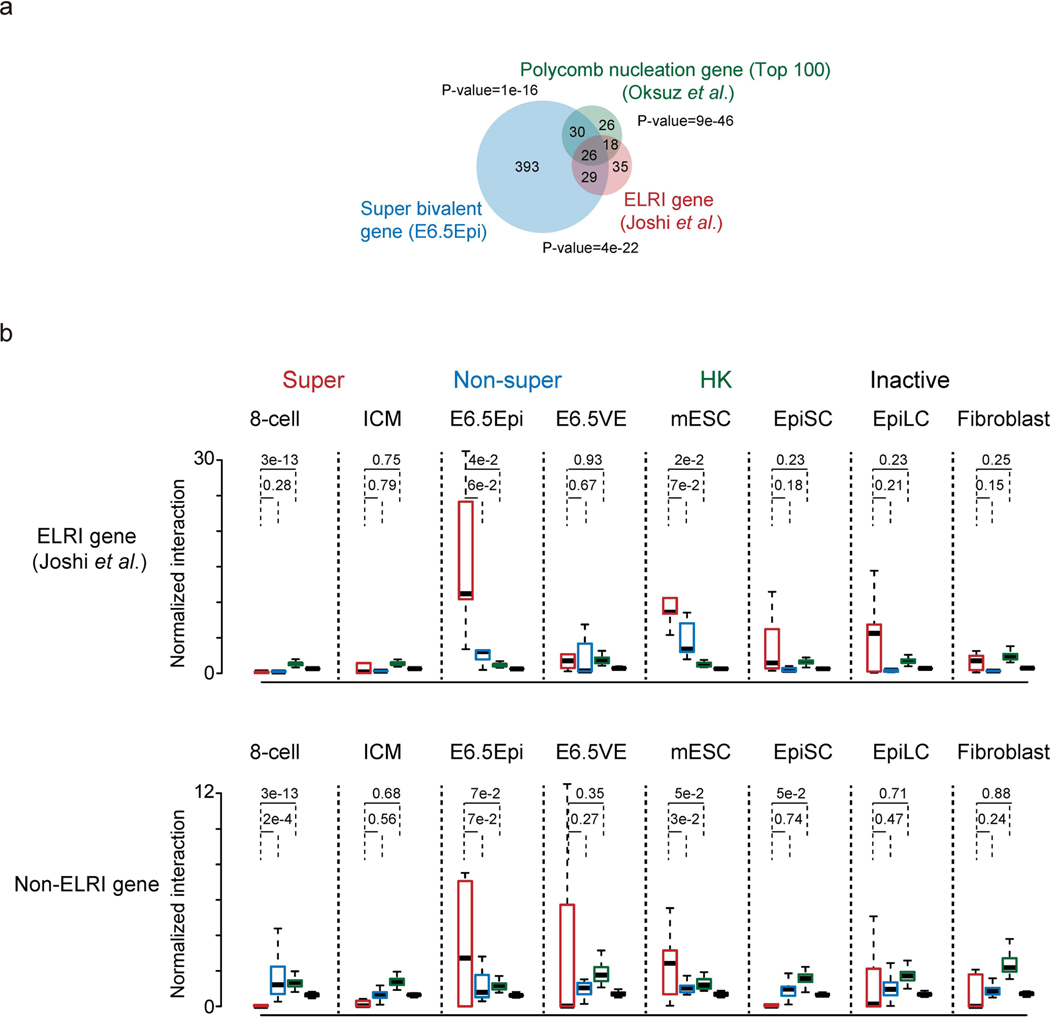
a, A Venn diagram shows the overlap between ELRI genes10 (n=108), top 100 Polycomb nucleation genes55, and super bivalent genes identified in E6.5Epi (see Methods). The P-values showing the overlap among pairwise comparison were calculated by Fisher test. b, Boxplots showing the normalized interaction frequencies among different gene groups in 8-cell, ICM, E6.5Epi, E6.5VE, mESC, EpiSC, EpiLC and fibroblast for ELRI bivalent genes(top) and non-ELRI bivalent genes (bottom). Super, super bivalent genes; Non-super, non-super bivalent genes; HK, housekeeping genes; Inactive, non-bivalent inactive genes (Methods). The median of each dataset is shown by the center line. The bottom, top edges and whiskers represent the twenty-fifth and seventy-fifth percentiles, and 1.5 times the interquartile range (IQR), respectively. Two-sided P-values calculated by t-test are also shown.