
Extended Data Fig. 10 |. Strong spatial clustering of developmental genes in E6.5 epiblast.
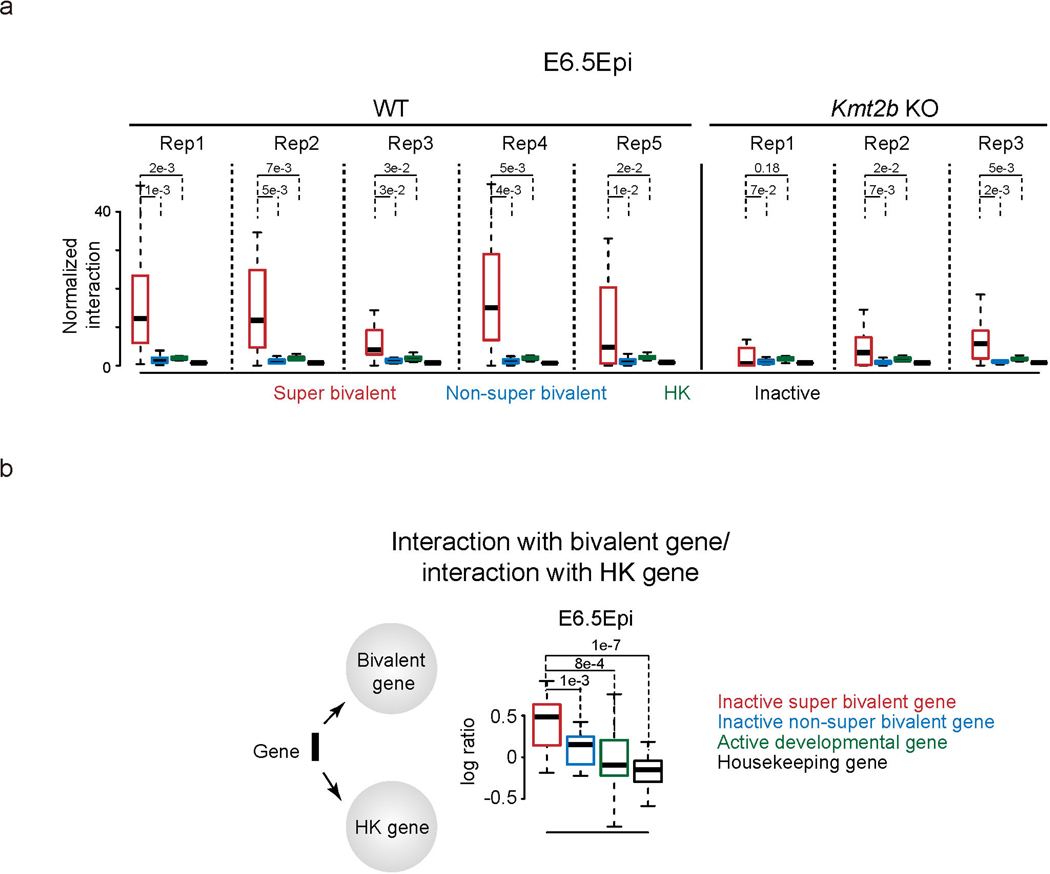
a, Boxplots showing the normalized interaction frequencies among genes in each gene group in wild-type (n = 5) and Kmt2b−/− (n=3) E6.5 Epi. P-values calculated by two-sided t-test are also shown. b, Left, a schematic diagram shows the relative spatial position of a selected gene defined by its interactions with developmental genes divided by its interactions with housekeeping genes. Right, boxplots showing the log ratios of such bivalent/housekeeping gene interactions for different gene groups (inactive, active developmental genes, housekeeping genes) in E6.5 epiblast.