
Fig. 4 |. Loss of super bivalent H3K4me3 is associated with aberrant activation of developmental genes.
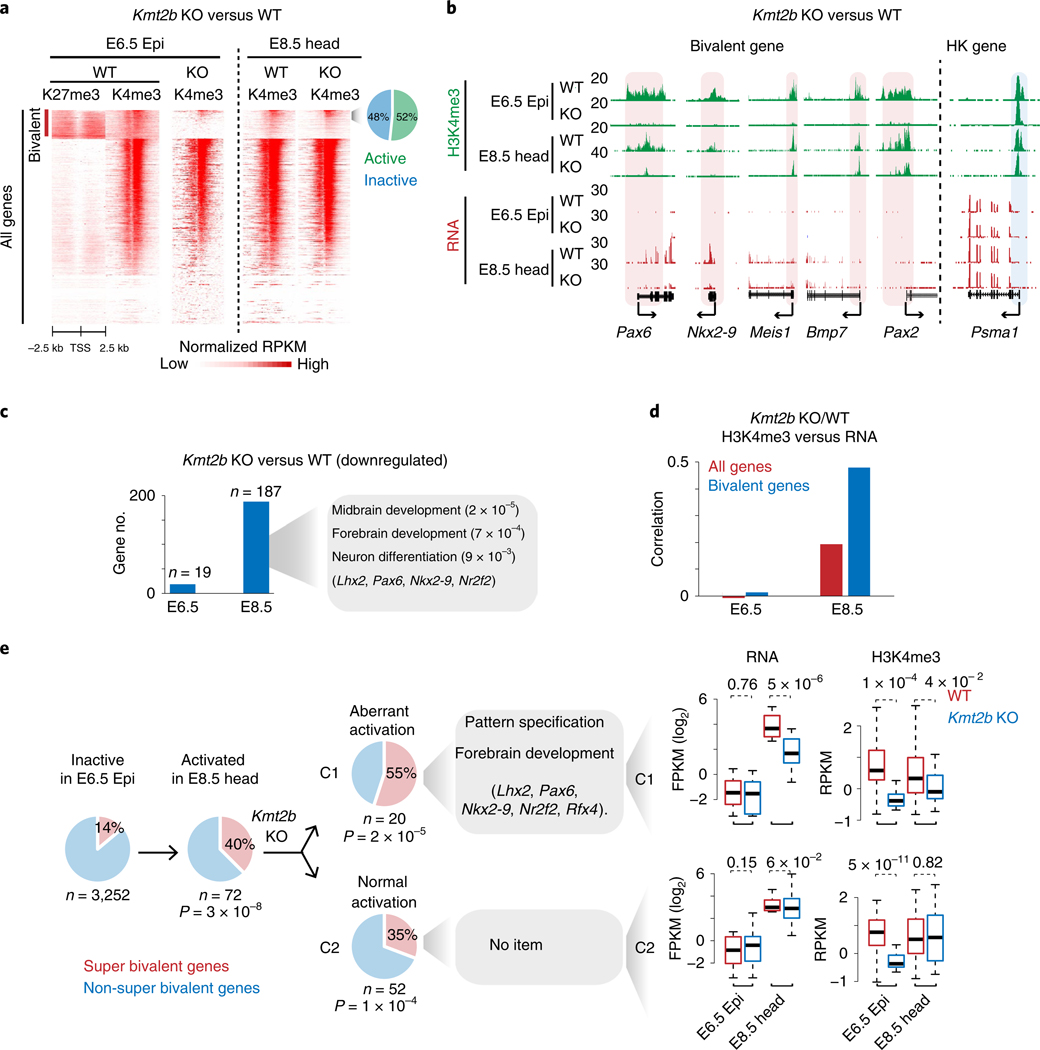
a, Heatmaps showing H3K27me3 and H3K4me3 enrichment at all promoters for WT and Kmt2b−/− embryos. The pie chart shows the percentages of active and inactive bivalent genes with enriched H3K4me3 (normalized RPKM > 0.5) in E8.5 Kmt2b−/− tissues. b, Snapshots showing H3K4me3 and gene expression at developmental genes for both WT and Kmt2b−/− embryos. The housekeeping gene Psma1 is shown as a control. Promoter H3K4me3 is shaded. The genome browser view scales were adjusted on the basis of the global data range. c, Bar charts showing the numbers of genes that are downregulated in E6.5 Epi and E8.5 head tissues in Kmt2b−/− embryos. GO and example genes at E8.5 are listed. d, Bar charts showing the Spearman correlation of changes between promoter H3K4me3 and gene expression for all genes and bivalent genes in WT (n = 3) and Kmt2b−/− (n = 3 for E6.5, n = 2 for E8.5) embryos. e, The pie charts show the percentages of super and non-super bivalent genes for inactive (FPKM < 2, n = 3,252) bivalent genes in E6.5 Epi (left). Among 72 genes that are activated (FPKM > 5) in E8.5 head (middle), 52 (C2) are activated normally while 20 (C1) show defective activation in Kmt2b−/− E8.5 embryos (right). The GO terms are also listed. The P values (hypergeometric test) show the enrichment of super bivalent genes in C1 or C2 (versus all inactive bivalent genes in E6.5 Epi). Boxplots show the gene expression and H3K4me3 enrichment in C1 or C2 for WT (n = 2) and Kmt2b−/− (n = 2) embryos. The P values were calculated by a one-tailed t-test. The median of each dataset is indicated by the center line. The bottom, top edges and whiskers represent the 25th and 75th percentiles and 1.5 times the interquartile range (IQR), respectively.