
Fig. 6 |. Super bivalent genes show strong spatial clustering.
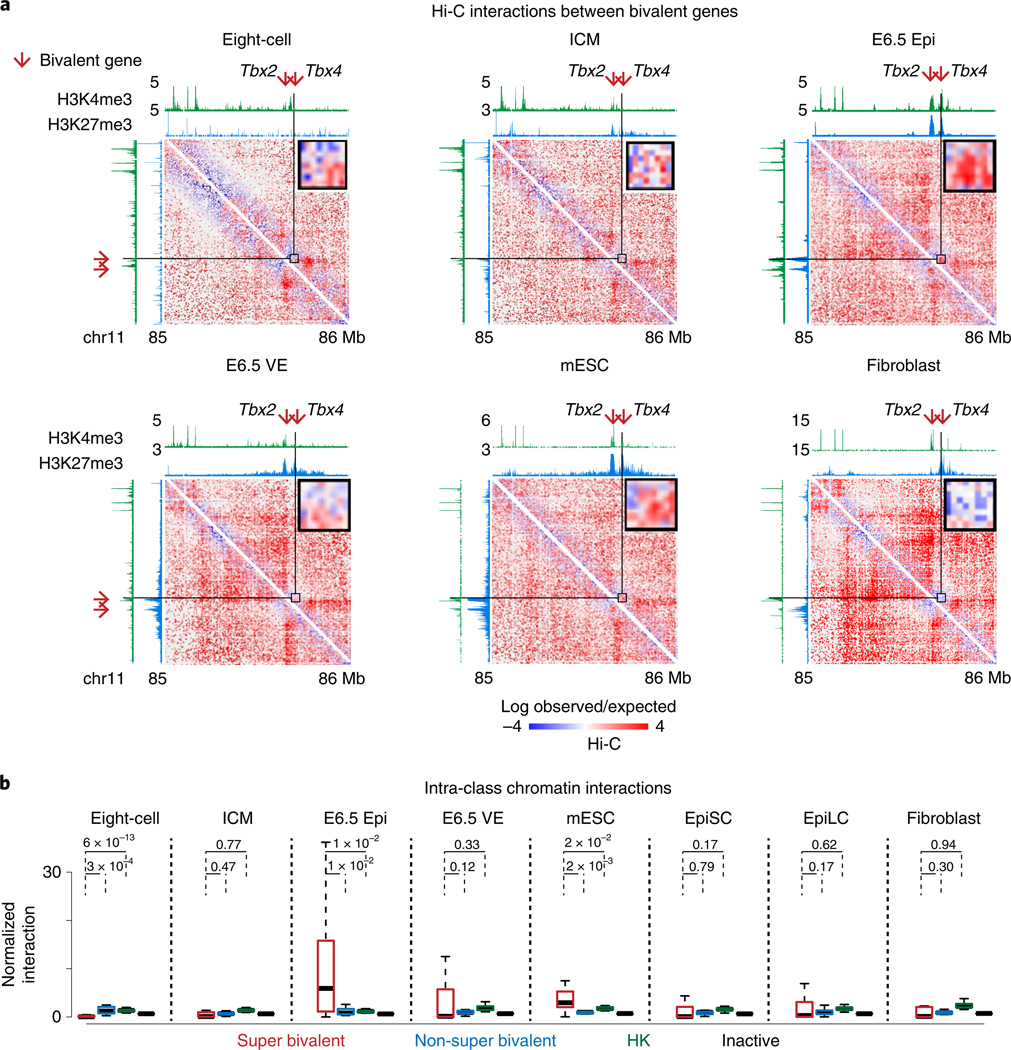
a, Heatmaps (5-kb resolution) showing the normalized interaction frequencies in eight-cell, ICM, E6.5 Epi, E6.5 VE, mESCs33 and fibroblasts57 at chromosome 11 (85–86Mb). A magnified view shows interactions between super bivalent genes Tbx2 and Tbx4. Each sample has comparable c/s-long reads (−115 million). The enrichment of H3K4me3 and H3K27me3 at each stage from this study and previous work28,29,47,58 is shown above the interaction heatmaps. b, Boxplots showing the normalized interaction frequencies among genes in each gene group in various cell types. Super bivalent, super bivalent genes; non-super bivalent, non-super bivalent genes; HK, housekeeping genes; inactive, nonbivalent inactive genes (Methods). The median of each dataset is indicated by the center line. The bottom, top edges and whiskers represent the 25th and 75th percentiles and 1.5 times the IQR, respectively. P values calculated by two-sided t-test are also shown.