
Extended Data Fig. 1 |. Global view of histone modifications and chromatin accessibility in mouse early lineages.
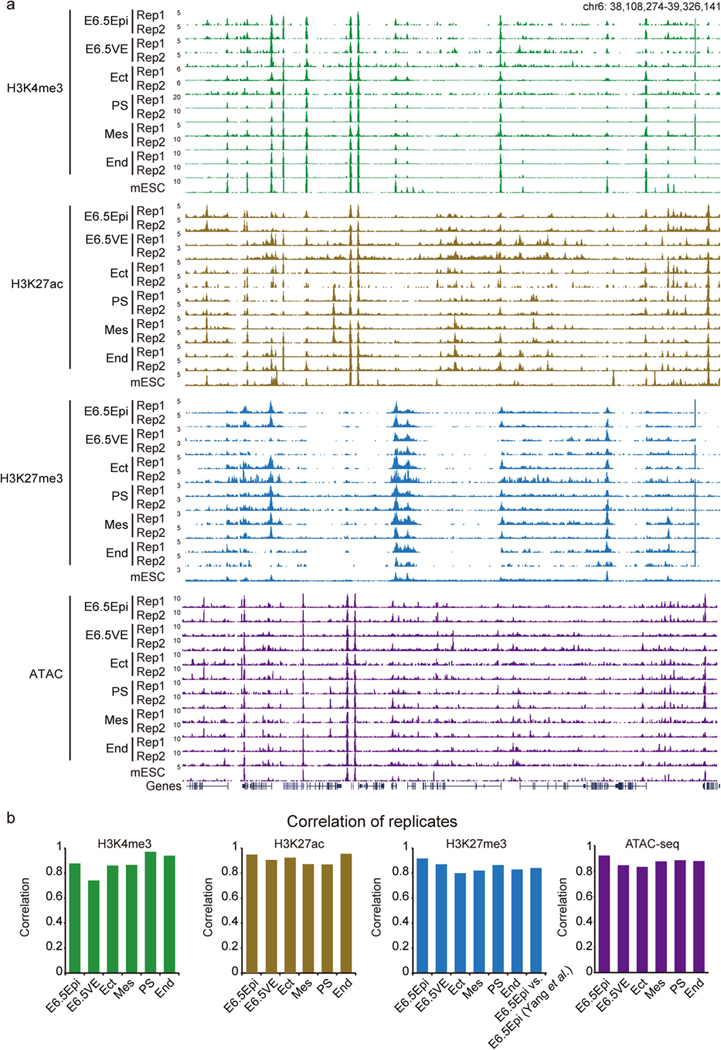
a, Snapshots showing two replicates of H3K4me3, H3K27ac, H3K27me3, and ATAC-seq in E6.5Epi, E6.5VE, Ect, PS, Mes, and End at E7.5. mESC data from ENCODE47 are also shown for comparison. The genome browser view scales were adjusted based on the global data range. b, The Pearson correlation between two replicates for H3K4me3, H3K27me3, H3K27ac, and ATAC-seq in post-implantation lineages. The correlation between our dataset and a published dataset73 for H3K27me3 in E6.5 epiblast is also shown.