
Extended Data Fig. 2 |. Global view of histone modifications, chromatin accessibility, and dynamics of putative enhancers during mouse early lineage specification.
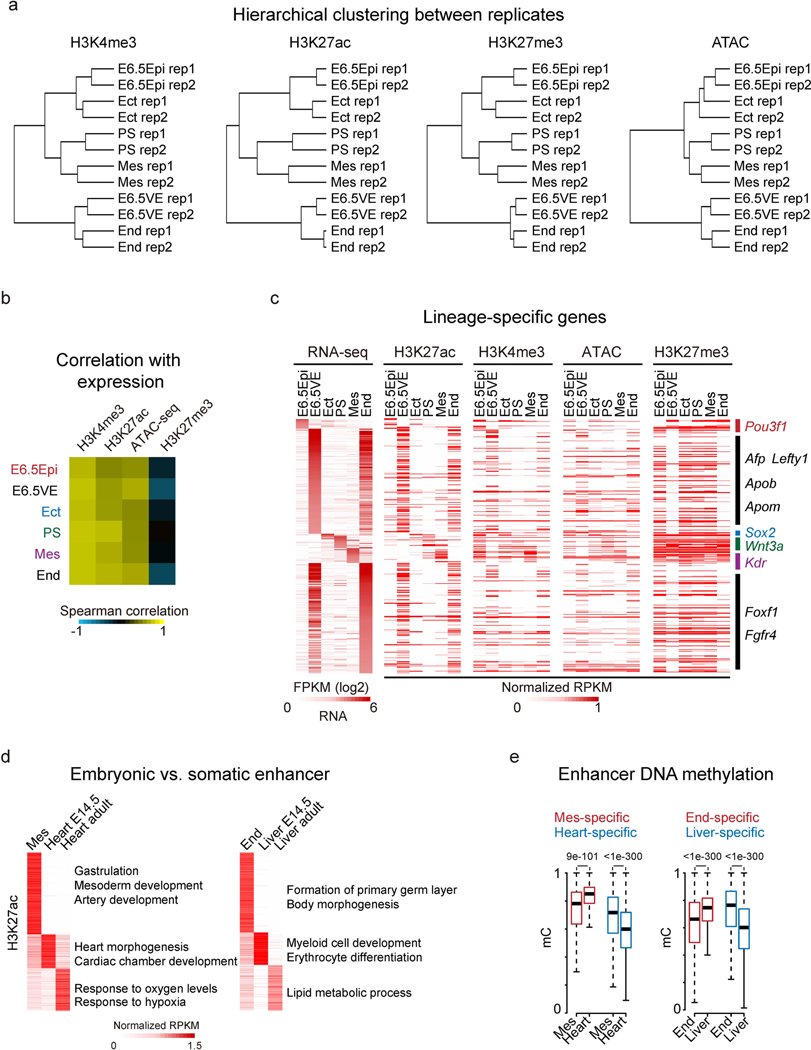
a, Hierarchical clustering of two replicates for histone modifications and ATAC-seq data at promoters among post-implantation tissues. b, The heatmap showing the Spearman correlation between gene expression and enrichment of histone modifications and open chromatin at promoters in the post-implantation embryos. c, Heatmaps showing gene expression and related histone modifications/open chromatin enrichment at promoters for lineage-specific genes. d, Heatmaps showing tissue-specific enhancers from mesoderm to heart (left), and endoderm to liver (right). GO terms enriched for each tissue-specific enhancers are also listed. Somatic enhancers were obtained from a previous study47. e, Boxplots showing the dynamics of DNA methylation for tissue-specific enhancers34,47 during development. The median of each dataset is shown by the center line. The bottom, top edges and whiskers represent the twenty-fifth and seventy-fifth percentiles, and 1.5 times the interquartile range (IQR), respectively.