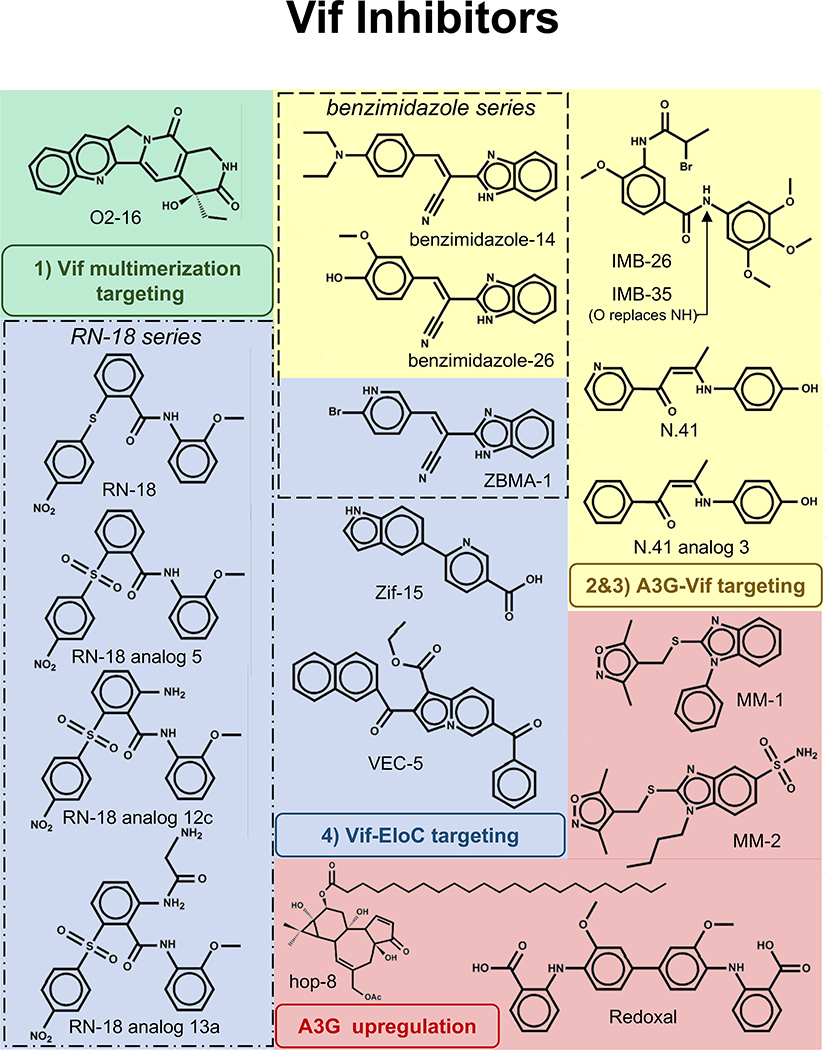
Figure 3. 2D depictions of small molecule Vif inhibitors.
Groups of compounds are color coded according to the interactions in Figure 2. These include: 1) Vif multimerization (green), 2 & 3) A3G-Vif (yellow), 4) Vif-EloC (blue) and compounds targeting A3G upregulation (red). IMB-26 and IMB-35 have similar structures but differ in that there is an O in place of NH (arrow pointing to the site of modification in IMB-35). Boxes outline the RN -18 series (dotted box) and benzimidazole series (dashed box).

