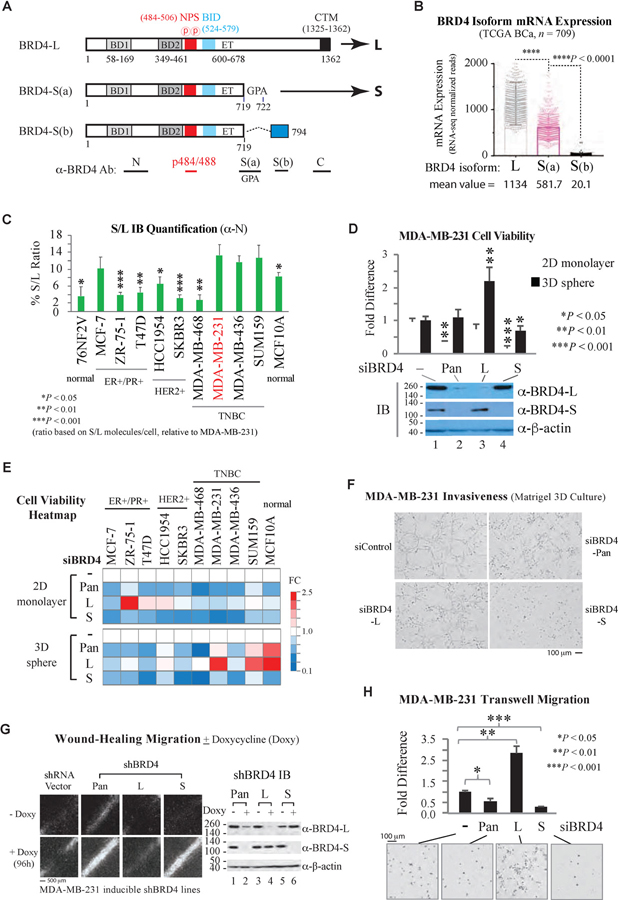
Figure 1. Opposing Functions of BRD4 Isoforms in Breast Cancer Cell Proliferation and Migration.
(A) Schematic of BRD4 domain features and antibody-targeting regions for a long (L) and two short isoforms S(a) and S(b). BRD4-S(a) is subsequently abbreviated as BRD4-S.
(B) BRD4 isoform mRNA levels in breast cancer (BCa) patients derived from RNA-seq-normalized reads (TCGA BCa) multiplying isoform PSI (TCGA SpliceSeq). Data are mean ± s.e.m. (standard error of the mean). P, two-way ANOVA.
(C) Ratio (S/L) of cellular BRD4-S and BRD4-L molecules quantified by immunoblotting (IB) with ⍺-BRD4 N antibody. Data are mean ± s.e.m. P, two-tailed t-test.
(D) MDA-MB-231 cell viability in monolayer (2D) and low-attachment sphere (3D) cultures following BRD4 pan, isoform, or control (-) siRNA knockdown. Data are mean ± s.d. (standard deviation). P, two-tailed t-test (relative to siControl).
(E) Heatmap summarizing cell viability fold change (FC) of BRD4 isoform knockdown in 10 cell lines.
(F) Representative images of invasion assay upon BRD4 isoform knockdown.
(G) Representative images of wound-healing assay performed in doxycycline (doxy)-inducible shBRD4 stable lines.
(H) Serum-induced Transwell migration assay. Data are mean ± s.e.m. Images are representative of at least three biological replicates.
Significance: *P < 0.05, **P < 0.01, ***P < 0.001, ****P < 0.0001

