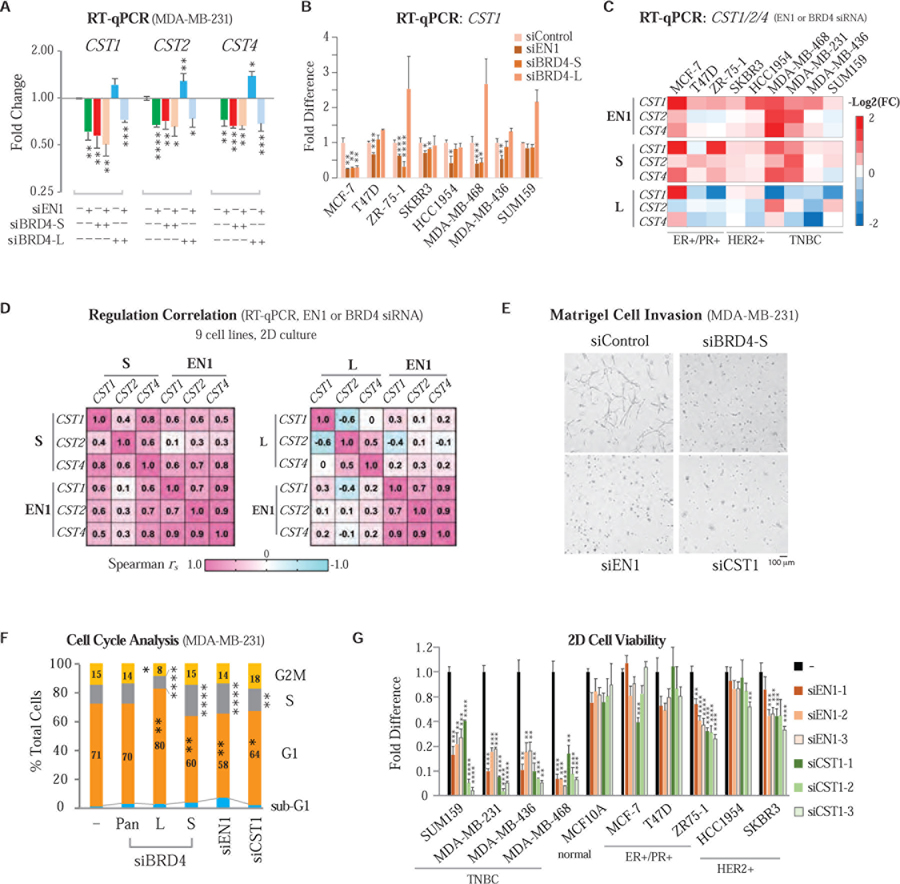
Figure 6. Knockdown of EN1 or CST1 Suppresses TNBC Cell Proliferation, Invasion and Cell Cycle Progression as Seen with BRD4-S Knockdown.
(A) RT-qPCR showing dual knockdown of EN1 and BRD4-S reduces CST1/2/4 expression comparable to individual knockdown. Data are mean ± s.d. P, two-tailed t-test.
(B) RT-qPCR of CST1 expression upon EN1 and BRD4 isoform knockdown in eight BCa cell lines. Fold difference is mean ± s.e.m. P, two-tailed t-test.
(C) Heatmap of CST1/2/4 expression following EN1, BRD4-S or BRD4-L knockdown in nine BCa cell lines.
(D) Spearman’s coefficient (rs) showing BRD4-S exhibiting positive and better correlation than BRD4-L for EN1-regulated CST1/2/4 gene expression collectively measured in nine BCa lines as analyzed in (C).
(E) Representative images of MDA-MB-231 cell invasion analyzed in 3D Matrigel culture upon BRD4-S, EN1 or CST1 knockdown.
(F) Cell cycle profiles of MDA-MB-231 following target-specific or control siRNA knockdown. P, two-tailed t-test.
(G) Cell viability of 10 cell lines in 2D culture with or without EN1 or CST1 knockdown. Data are mean ± s.e.m. P, two-tailed t-test.

