
Fig. 1.
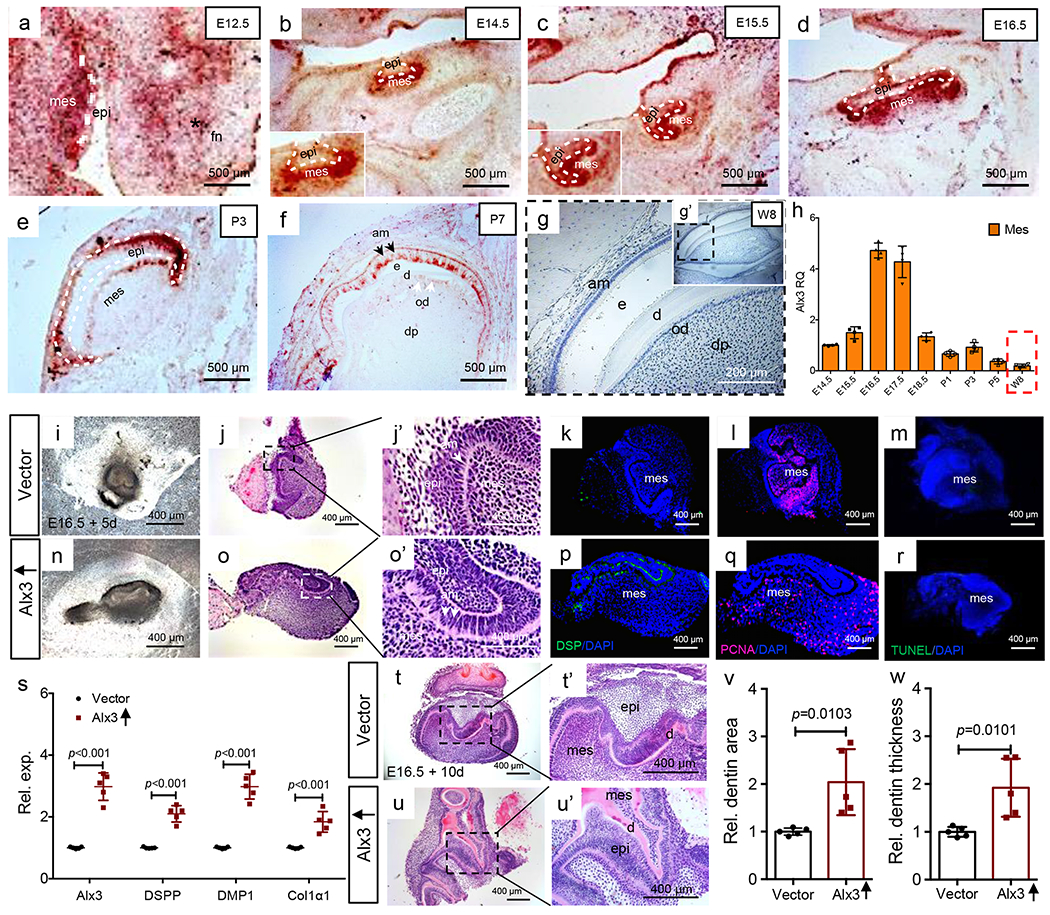
Alx3 immunomapping and tissue reconstitution, a-f: Alx3 in situ hybridization from E12.5 to postnatal day 7 tooth organs. White dash lines: boundary of epithelium and mesenchyme. Scale bar, 500 μm. 3 independent biological samples. g,g’: Alx3 immunohistochemistry of molar tooth organ of an 8-wk-old CD1 mouse and higher magnification (insert). Scale bar, 200 μm. 2 independent biological samples, h: Real-time PCR of mesenchyme Alx3 expression (n=4 independent biological samples). Presented as mean±SD, bars represent standard deviation (SD). Red dash box: Mesenchyme Alx3’s expression of 8-wk-old adult molar (w8). i-o’: Photomicrograph and HE images of reconstituted E16.5 tooth organs following 5-day culture. A total of 5 independent biological samples. k,r: Dentin sialoprotein (DSP) immunofluorescence; Proliferating cell nuclear antigen (PCNA) immunofluorescence; TUNEL staining. Scale bar, 400 μm. 3 independent biological samples, s: Real-time PCR of Alx3, DSPP (dentin sialophosphoprotein), DMP1 (dentin matrix protein-1) and Col1a1 (collagen 1 alpha 1) in reconstituted tooth organs following 5-day culture (n=5 independent biological samples; presented as mean±SD and p value; p values calculated by two-sided Student’s t-tests). t-u’: Photomicrographs and HE images of E16.5 reconstituted tooth organs following 10-day culture. 5 independent biological samples. Scale bar, 400 μm. v,w: Quantified dentin area and thickness (n=5 independent biological samples; presented as mean±SD and p value; p values calculated by two-sided Student’s t-tests). mes: mesenchyme; epi: epithelium; fn: frontonasal process; e: enamel; d: dentin; od: odontoblasts; dp: dental pulp.