
Fig. 4.
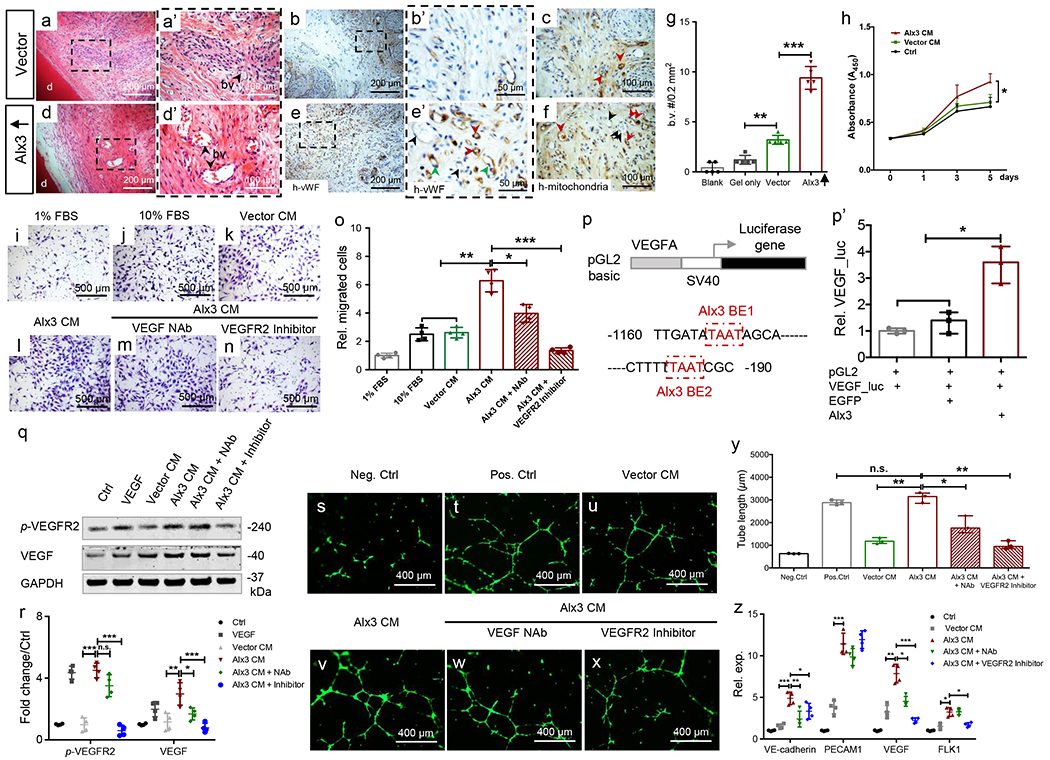
Alx3-restored adult mesenchyme stem/progenitor cells (MSCs) induced angiogenesis and VEGF signaling. a,a’,d,d’: Angiogenesis in regenerated tissues. a,d: scale bar, 200 μm. a’,d’: scale bar, 100 μm. d: native dentin. b,b’,e,e’: Human von Willebrand factor immunohistochemistry. Green arrowheads: endothelial cells of human origin (e’); black arrowheads: endothelial cells of host (mouse) origin (e’); red arrowheads: chimeric blood vessels (e’). b,e: scale bar, 200 μm. b’,e’: scale bar, 50 μm. c,f: Human mitochondria staining; red arrowheads: human cells; black arrowheads: host (mouse) cells. Scale bar, 100 μm. a-h: n=5 independent biological samples, g: Blood vessel (b.v.) quantification (n=5 independent biological samples; presented as mean±SD; p values calculated by one-way ANOVA with Bonferroni; **: p<0.01; ***: p<0.001). h: CCK8 of HUVECs treated with conditioned medium by vector control or Alx3-restored MSCs (n=4 independent biological samples; Presented as mean±SD; p values calculated by one-way ANOVA with Bonferroni; *: p<0.05). i-o: Transwell migration assay by Alx3 conditioned medium or with neutralizing antibody or VEGFR2 inhibitor (n=4 independent biological samples; presented as mean±SD; p values calculated by one-way ANOVA with Bonferroni; *: p<0.05; **; p<0.01; ***: p<0.001). Scale bar, 500 μm. p: Mouse VEGFA promoter luciferase reporter with two Alx3-binding elements in red boxes. BE: binding element, p’: VEGF luciferase assay upon Alx3 transfection (n=3 independent biological samples; presented as median with range; p values calculated by Kruskal-Wallis test; *: p<0.05). q,r: VEGF production and p-VEGFR2 activation by western blot and quantification (n=4 independent biological samples; presented as mean±SD; p values calculated by one-way ANOVA with Bonferroni; *: p<0.05; **; p<0.01; ***: p<0.001; n.s.: not significant), s-x: Tube formation of HUVECs treated by conditioned medium, Alx3 CM with or without NAb or VEGFR2 inhibitor. Scale bar, 400 μm. 3 independent biological samples, y: Tube length quantification (n=3 independent biological samples; presented as median with range; p values calculated by Kruskal-Wallis test; *: p<0.05; **; p<0.01; n.s.: not significant), z: Real-time PCR of VE-cadherin, PECAM1, VEGF and FLK1 (n=4 independent biological samples; presented as mean±SD; p values calculated by one-way ANOVA with Bonferroni; *: p<0.05; **: p<0.01; ***: p<0.001).