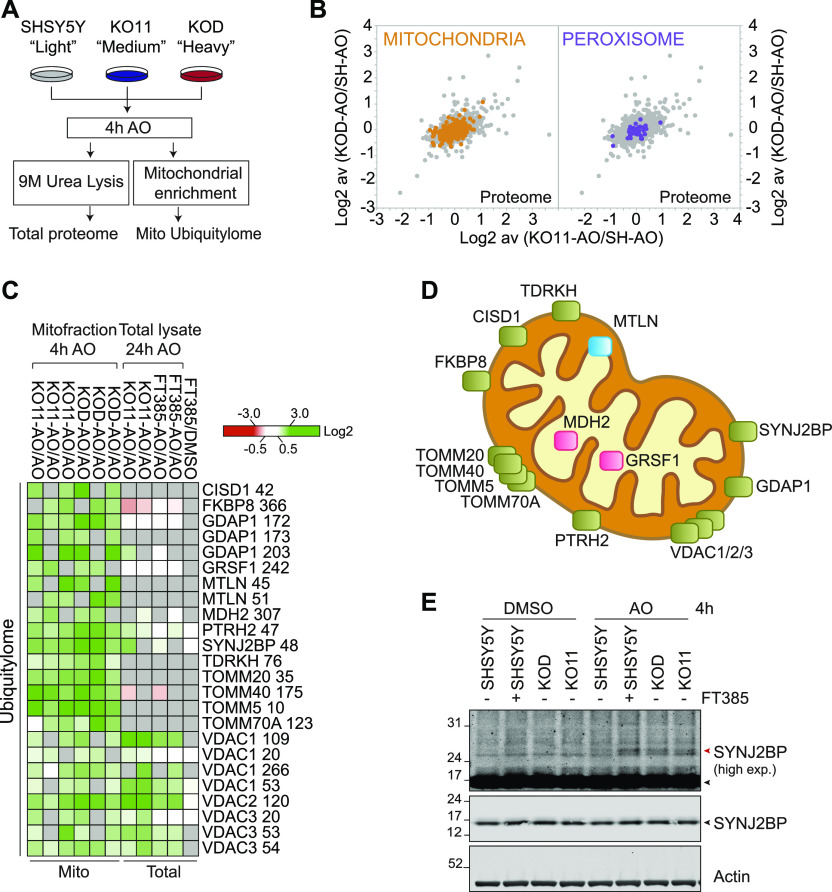
Figure 5. Proteomic analysis of the mitochondria-enriched ubiquitylome in USP30 KO SHSY5Y cells.
(A) Schematic flow chart of SILAC based quantitative ubiquitylome and proteome analysis comparing two USP30-KO clones (KOD-sgRNA#1 and KO11-sgRNA#2) to wild-type SHSY5Y cells. Cells were metabolically labelled by SILAC as shown and treated for 4 h with AO (1 μM). Cells were then either lysed for total proteome analysis or further processed by subcellular fractionation. The mitochondrial fraction was used as the starting material for the ubiquitylome analysis. (B) Graphs depicting the fold change (log2) in the proteome of AO-treated USP30 KOD versus wild-type SHSY5Y (SH) (y-axis) and USP30 KO11 compared with SHSY5Y cells (x-axis). Mitochondrial (Integrated Mitochondrial Protein Index database; http://www.mrc-mbu.cam.ac.uk/impi; “known mitochondrial” only) and peroxisomal proteins (peroxisomeDB; http://www.peroxisomedb.org) proteins are highlighted in orange and purple, respectively. Each dot represents a single protein identified by at least two peptides and the ratio shows the average of three experiments. (C) Heat map showing diGly containing peptides that are increased consistently in at least four of six experimental conditions by log2 ≥ 0.8. The corresponding data from the total ubiquitylome experiment shown in Fig 4 are also indicated. Grey indicates the protein was not seen in that condition. VDAC3 K53 and K54 correspond to equivalent lysines in two distinct isoforms. (D) Depiction of the localisation of USP30 sensitive depolarisation-induced ubiquitylated proteins within mitochondria (enriched proteins shown in (C)). Defined as outer mitochondrial membrane (green), inner mitochondrial membrane (blue), or matrix (pink). (E) Western blot showing the appearance of mono-ubiquitylated species of SYNJ2BP in both USP30 KO clones (KO11 and KOD) and in USP30 inhibitor (FT385) treated cells. Cells were treated for 4 h with AO (1 μM) in the presence or absence of 200 nM FT385, then lysed in urea lysis buffer and analysed by Western blot. Black and red arrowheads indicate unmodified and ubiquitylated SYN2BP (high exp, higher exposure).
Source data are available for this figure.

