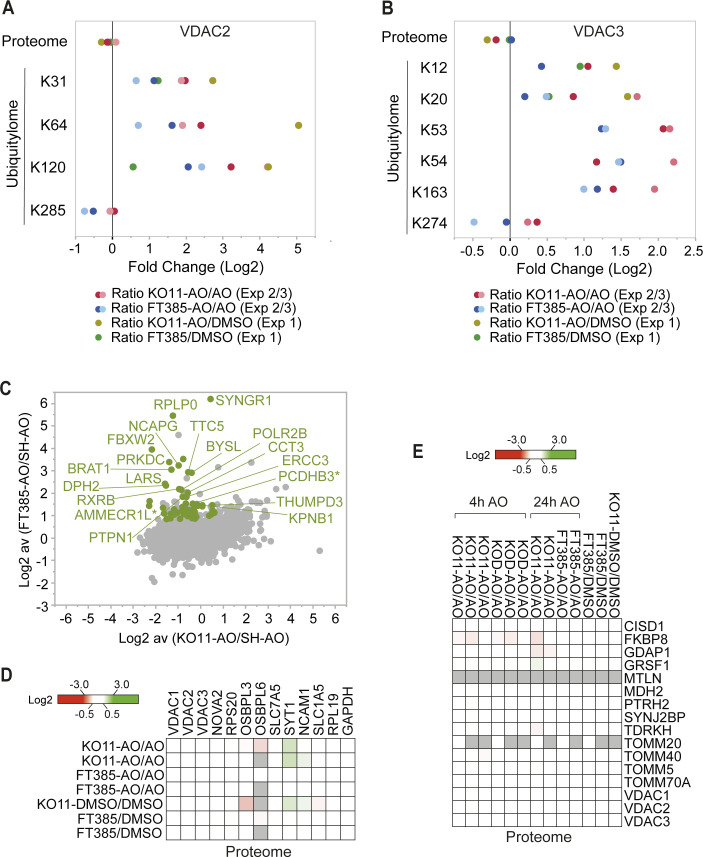
Figure S3. Ubiquitylome and total proteome changes in USP30 KO versus USP30 inhibitor–treated SHSY5Y cells.
(A, B) Fold change (log2) in proteome and individual diGly peptides (localisation ≥ 0.75) by site in VDAC2 and VDAC3 proteins. (C) Annotated version of the graph shown in Fig 4C depicting the fold change (log2) in the ubiquitylome of AO-treated SHSY5Y cells ± FT385 treatment (y-axis) and ± USP30 (x-axis). Each dot represents a single diGly peptide (localisation ≥ 0.75), and the ratio shows the average of two experiments. In green are shown diGly peptides that are increased consistently by log2 ≥ 0.8 in both USP30 inhibitor (FT385) treated but not in either USP30 KO11 data sets. Labelled are those diGly peptides that pass a log2 ≥ 1.2 threshold in both FT385 conditions. * indicates ambiguity of peptide assignment between family members (AMMECR1L, AMMECR1 and PCDHB3, PCDHB2). (D, E) Heat maps show total proteome data corresponding to the ubiquitylated peptides highlighted in Figs 4D and 5C, respectively. Grey indicates the protein was not seen in that condition.

