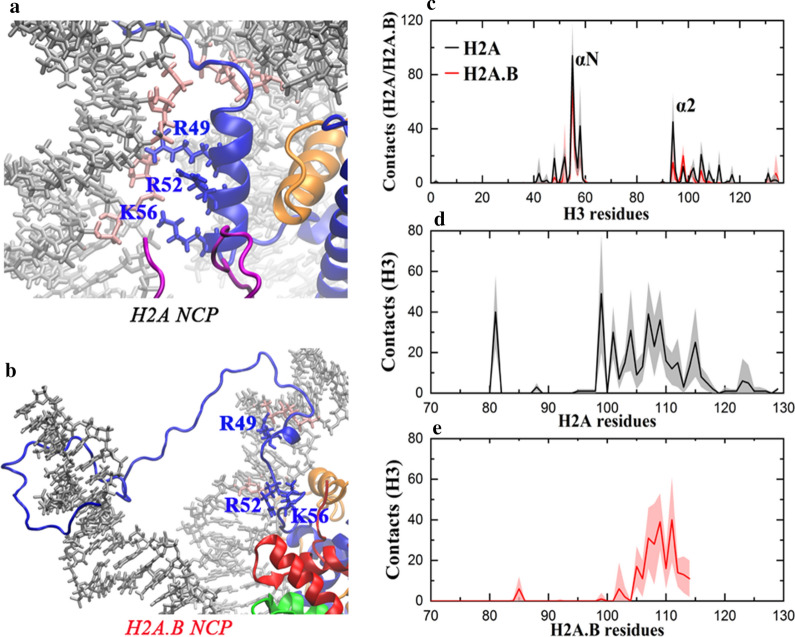
Fig. 3.
H2A.B disrupts the interactions between the H3 αN and DNA. a Interactions between the H3 αN and DNA in the H2A NCP, but b they are broken in the H2A.B NCP. The base pairs in contact with the H3 αN are colored in pink. c Average number of contacts of each residue in H3 with H2A (black) or H2A.B (red) during the AA-MD simulations. The αN and the α2 are labeled. d Average number of contacts of each residue in H2A with H3 during the AA-MD simulations. e Average number of contacts of each residue in H2A.B with H3 during the AA-MD simulations. In c–e, for each system, average values calculated from the three independent simulations are plotted, and standard deviations are shown as errors that are represented by shade. The contact numbers from the two copies of the same histone in one nucleosome structure are also averaged

