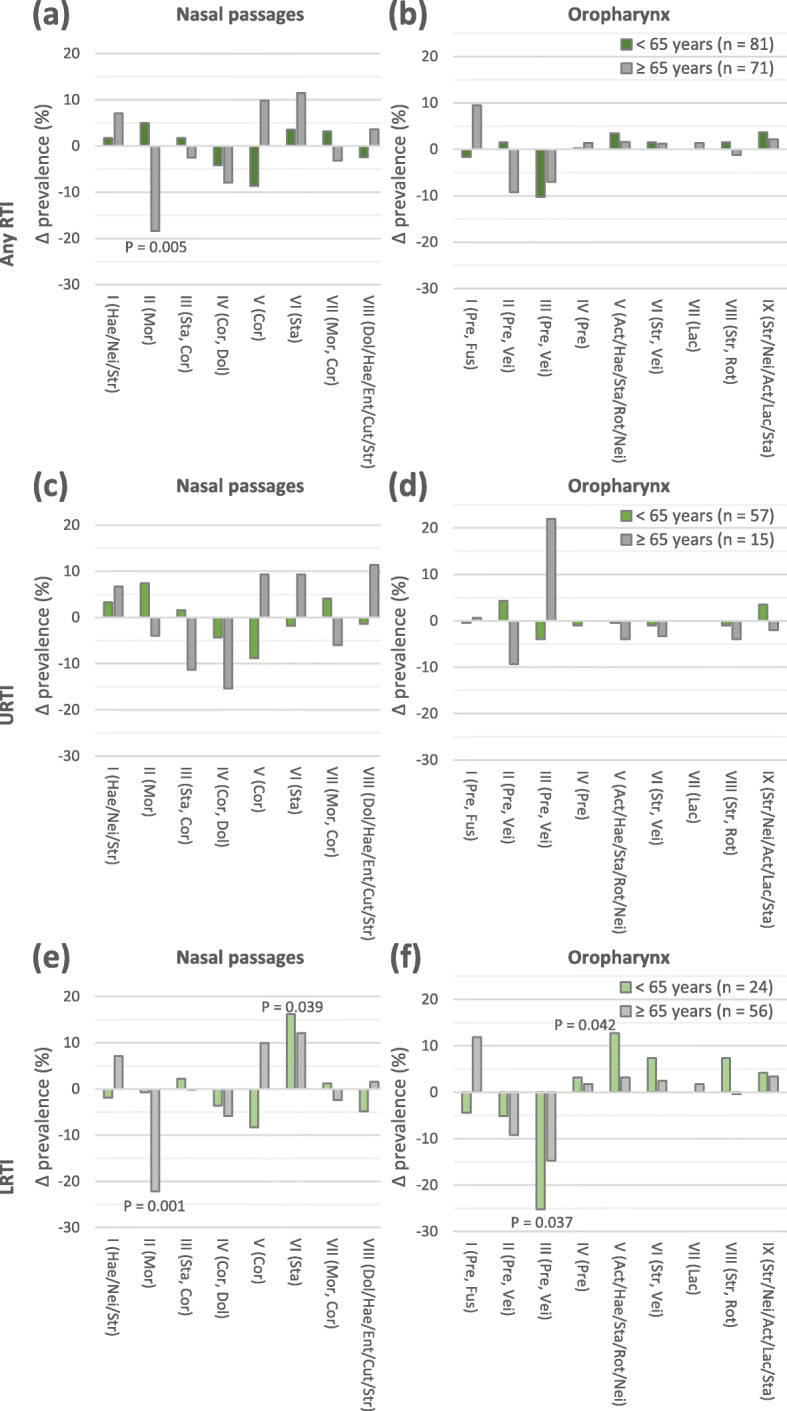
Fig. 2.

Comparison of prevalence of microbiota clusters between controls and patients per age group. a nasal and b oropharyngeal microbiota clusters of controls and patients with any respiratory tract infection (RTI). c nasal and d oropharyngeal microbiota clusters of controls and patients with an upper respiratory tract infection (URTI). e nasal and f oropharyngeal microbiota clusters of controls and patients with a lower respiratory tract infection (LRTI). Act: Actinobacillus; Cor: Corynebacterium; Cut: Cutibacterium; Dol: Dolosigranulum; Ent: Enterobacteriaceae; Fus: Fusobacterium; Hae: Haemophilus; Lac: Lactobacillus; Mor: Moraxella; Nei: Neisseria; Pre: Prevotella; Rot: Rothia; Sta: Staphylococcus; Str: Streptococcus; Vei: Veillonella. Genera separated from each other by a comma are both represented in a relatively high abundance in each microbiota profile of the relevant cluster. Genera separated from each other by a slash indicates that one of these genera is present in a relatively high abundance. All P-values are based on Fisher’s Exact test. Correction for multiple testing was not performed
