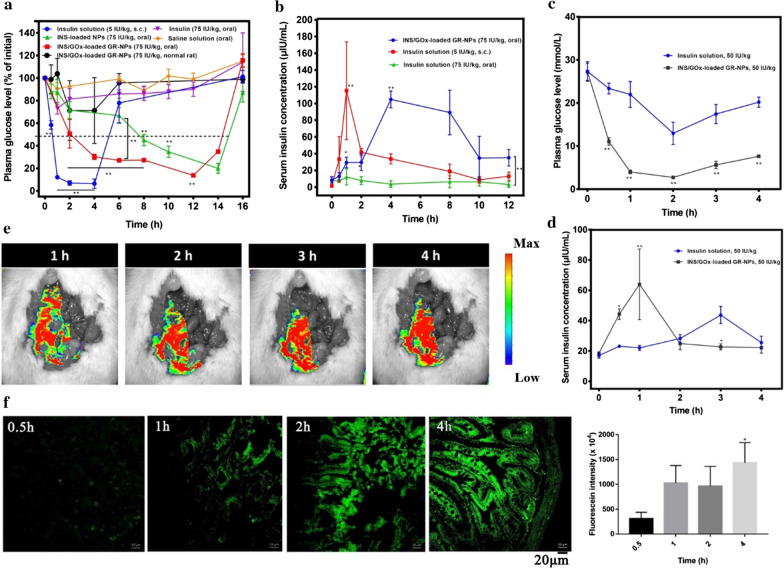
Fig. 7.
Plasma glucose levels in diabetic rats following oral administration of INS-loaded NPs, INS/GOx GR-NPs, saline or insulin solution. Intraperitoneal injection of insulin solution and in normal rats following oral administration of INS/GOx GR-NPs (a); serum insulin concentration in diabetic rats following oral administration of INS/GOx GR-NPs and insulin solution, intraperitoneal injection of insulin solution (b), *P < 0.05, **P < 0.01: significance: comparison between oral GR-NPs, INS-loaded NPs and s.c. administration insulin; plasma glucose levels in diabetic rats following ileal administration of INS/GOx GR-NPs and insulin solution (c); serum insulin concentration in diabetic rats following ileal administration of INS/GOx GR-NPs and insulin solution (d), *P < 0.05, **P < 0.01: significance: comparison between INS-loaded NPs and insulin; ex vivo living scanning image of rats after administration of FITC-INS/GOx GR-NPs for different times (1 h, 2 h, 3 h or 4 h) (e); CLSM images and fluorescence intensity of FITC-INS/GOx GR-NPs in intestinal tissue of rat after 0.5 h, 1 h, 2 h or 4 h oral administration (f)

