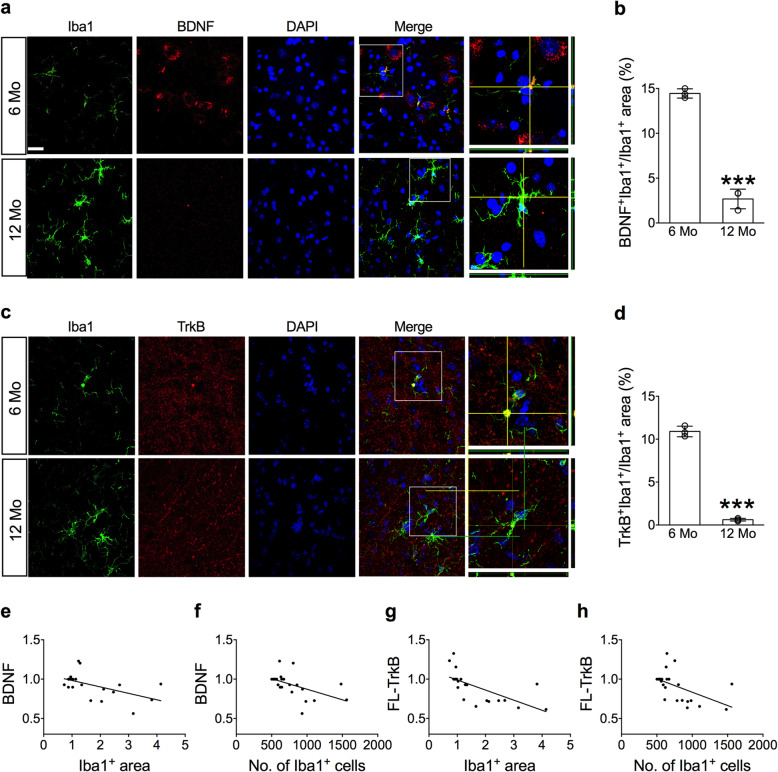
Fig. 2.
Downregulation of BDNF and TrkB in aged microglial cells. a–b Representative dual immunofluorescent images show the distribution of BDNF (a) and TrkB (c) in the Iba1+ cells in the SN of 6- and 12-month-old mice. Scale bar: 10 μm. The percent areas of BDNF+Iba1+/Iba1+ (b) and TrkB+Iba1+/Iba1+ (d) in the SN of 6- and 12-month-old mice. BDNF+ areas were detected from 31 cells in three 6-month-old mice and 56 cells in three 12-month-old mice; TrkB+ areas were obtained from 35 cells in three 6-month-old mice and 73 cells in three 12-month-old mice. ***p < 0.001 versus 6-month-old mice. e–h Correlations (Pearson) between the levels of BDNF and TrkB, and the area and number of Iba1+ cells (n = 24)

