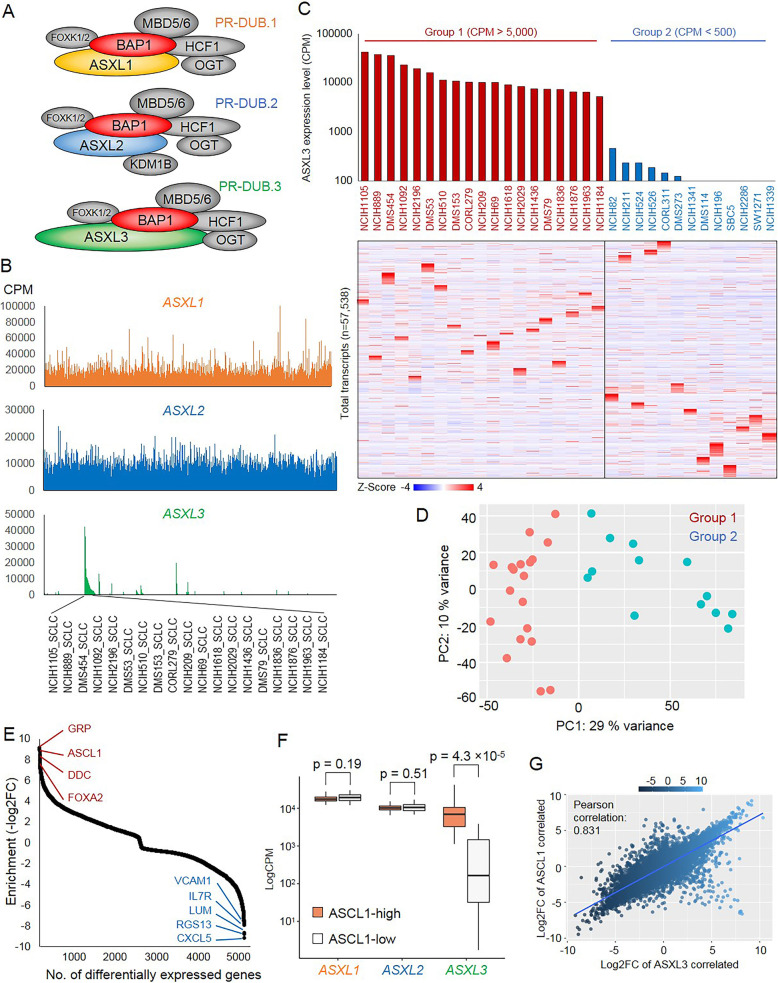
Fig. 1.
ASXL3 defines a subtype of SCLC with high expression of ASCL1. a Schematic of three BAP1 complexes, which is defined by 3 different additional sex-combs-like proteins ASXL1, ASXL2, and ASXL3. b The counts per million (CPM) value for ASXL1/2/3 expression in 1004 human cell lines. c The log2 (fold-change) heatmaps show the global gene expression profile in ASXL3-high (CPM > 5000) and ASXL3-low (CPM < 500) SCLC cell lines. d The PCA plot analysis indicated that the ASXL3-high and ASXL3-low cell lines are separated into two distinctive groups of SCLC cell types. e The gene expression enrichment analysis shows the most enriched genes in ASXL3-high and ASXL3-low SCLC cell lines. f The box plot shows the expression level of ASXL1, ASXL2, and ASXL3 between ASCL1-high and ASCL1-low SCLC cell lines. P value is calculated based on the t test. g The scatter plot shows the correlation between ASXL3-associated genes and ASCL1-associated genes via log2 fold-change

