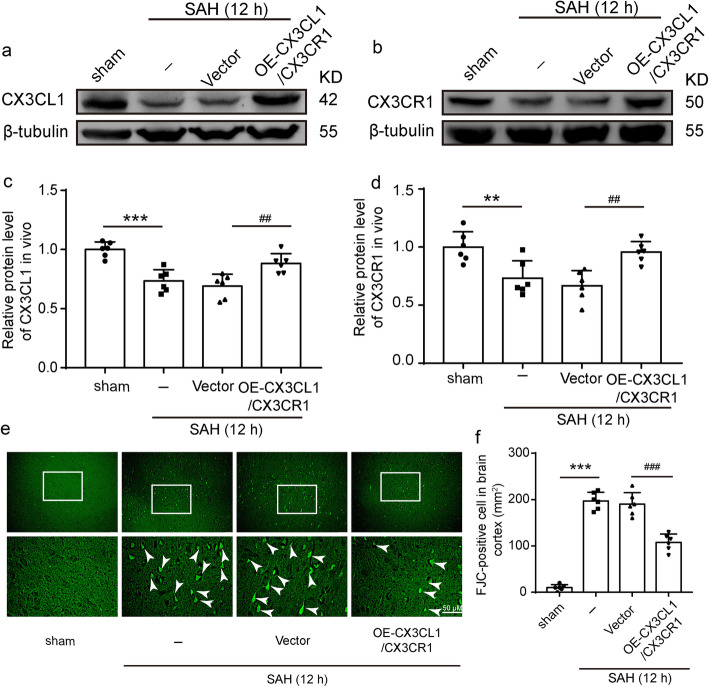
Fig. 3.
The effect of CX3CL1/ CX3CR1 overexpression on brain injury after SAH. a, b Western-blot analysis showed the protein levels of CX3CL1 and CX3CR1 under plasmid of CX3CL1/CX3CR1 intervention. c, d Quantification of CX3CL1 and CX3CR1 protein levels. e Fluoro-Jade C (FJC) staining (green) was performed to assess neuronal degeneration at 12 h after SAH and arrows pointed to FJC-positive cells. f Quantitative analysis of FJC-positive cells/mm2 in brain sections in each group. Scale bar = 50 μm. In c, d, the mean values for the Sham group were normalized to 1.0. In (c, d, f), all data are mean ± SD, n = 6. **P < 0.01, ***P < 0.001vs sham group; ##P < 0.01, ###P < 0.001vs SAH + vector group

