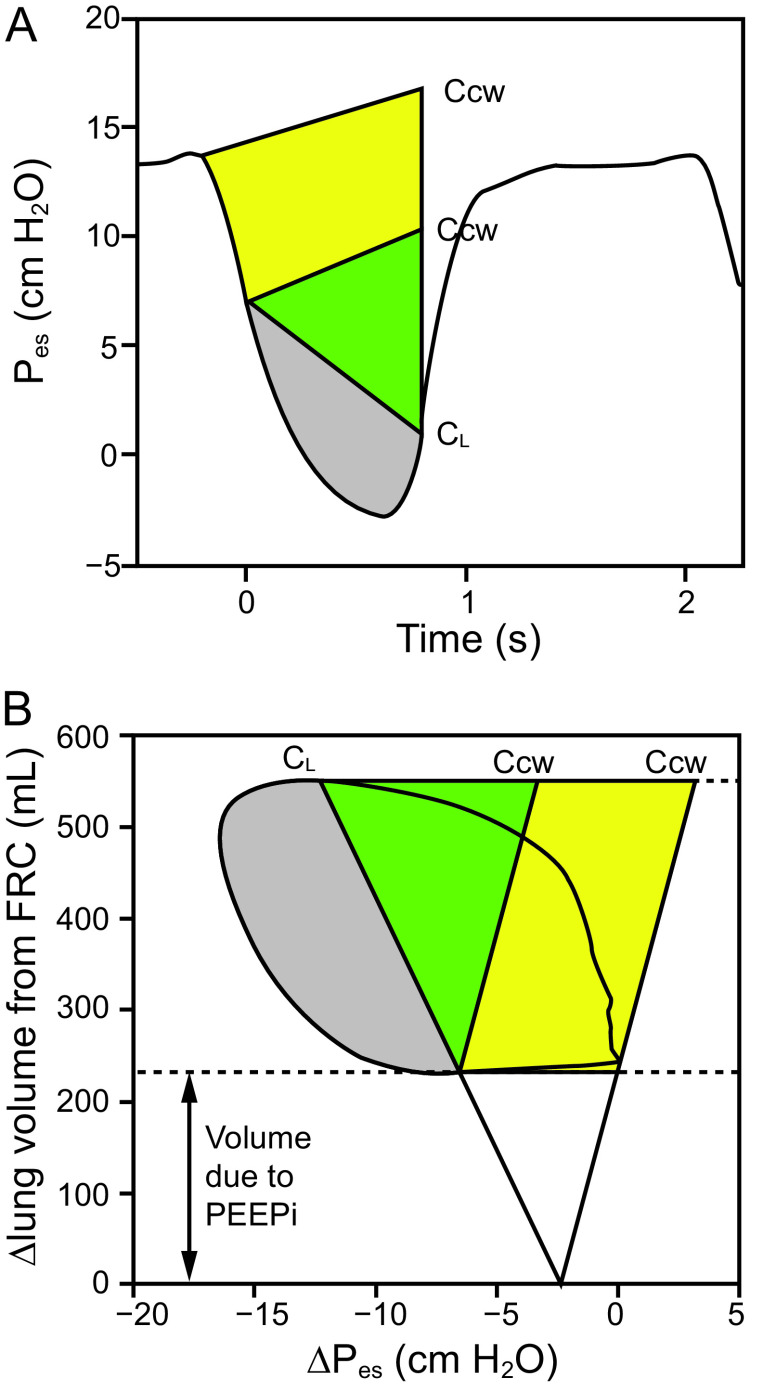
Fig. 5.
Examples of ways to assess patient effort with esophageal pressure. (A) Esophageal pressure (Pes) tracings. Ccw, estimated at 4% of vital capacity, has been superimposed on Pes at the onset of the fall in Pes and at the onset of inspiratory flow generation (ie, the first vertical line), together with dynamic CL. The colored area comprises the total pressure-time product (PTP) of respiratory muscle pressure. The yellow area is the PTP attributed to intrinsic PEEP, the green area represents elastic PTP, and the gray area represents resistive PTP. (B) Pressure-volume curve of Pes and lung volume. The Ccw and CL intersect at FRC. The yellow area represents work of breathing (WOB) attributed to intrinsic PEEP, the green area represents elastic WOB, and the gray area represents resistive WOB. Ccw = compliance of the chest wall; CL = compliance of the lung; FRC = functional residual capacity; PEEP = positive end-expiratory pressure; FRC = functional residual capacity; VC = vital capacity; PEEPi = intrinsic PEEP. Redrawn from data in reference 61.

