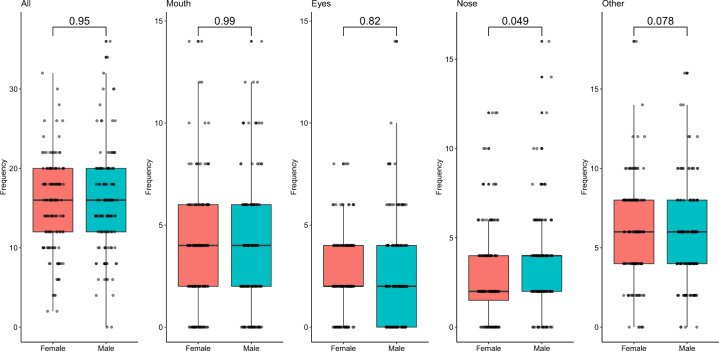
Fig. 1. Comparison of contact frequencies among locations during non-eating macro-activities.
Post-hoc analysis results for a all face contacts, b eye contacts, and c other contacts (not -mouth, -eyes, or -nose). Dunn’s test p values with Hochberg adjustment are indicated by color, where dark purple relates to non-statistically significant differences.

