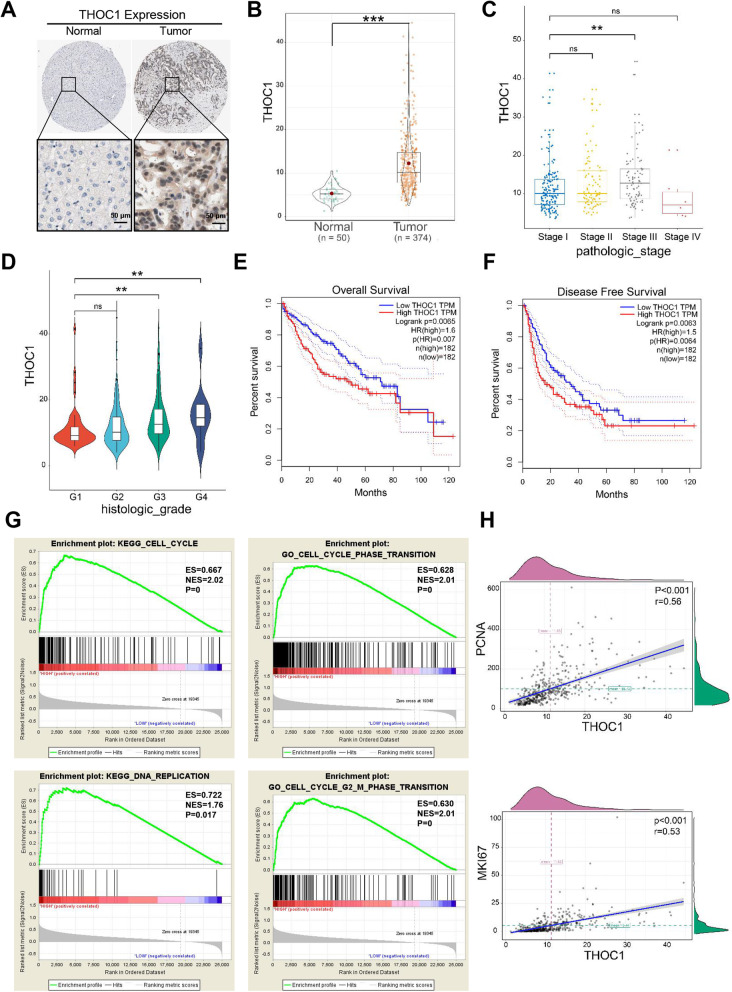
Fig. 1.
Expression level of THOC1 is closely related to the proliferation of HCC. a Representative immunohistochemistry images of THOC1 in normal cells and tumors cited from the Human Protein Atlas. b Statistical analysis of THOC1 expression level in normal and tumor cells based on the LIHC samples in The Cancer Genome Atlas (TCGA) database (Student’s t test; ***P < 0.001). Statistical analyses of THOC1 expression level in LIHC samples based on (c) pathology grade (one-way ANOVA; **P < 0.01) and (d) clinical stage (one-way ANOVA; **P < 0.01). e Overall survival and (f) disease free survival analysis separated by low and high THOC1 expressions in LIHC samples. g GSEA based on THOC1 expression. (h) Correlation analysis of THOC1 with PCNA and Ki67. **P < 0.01, ***P < 0.001

