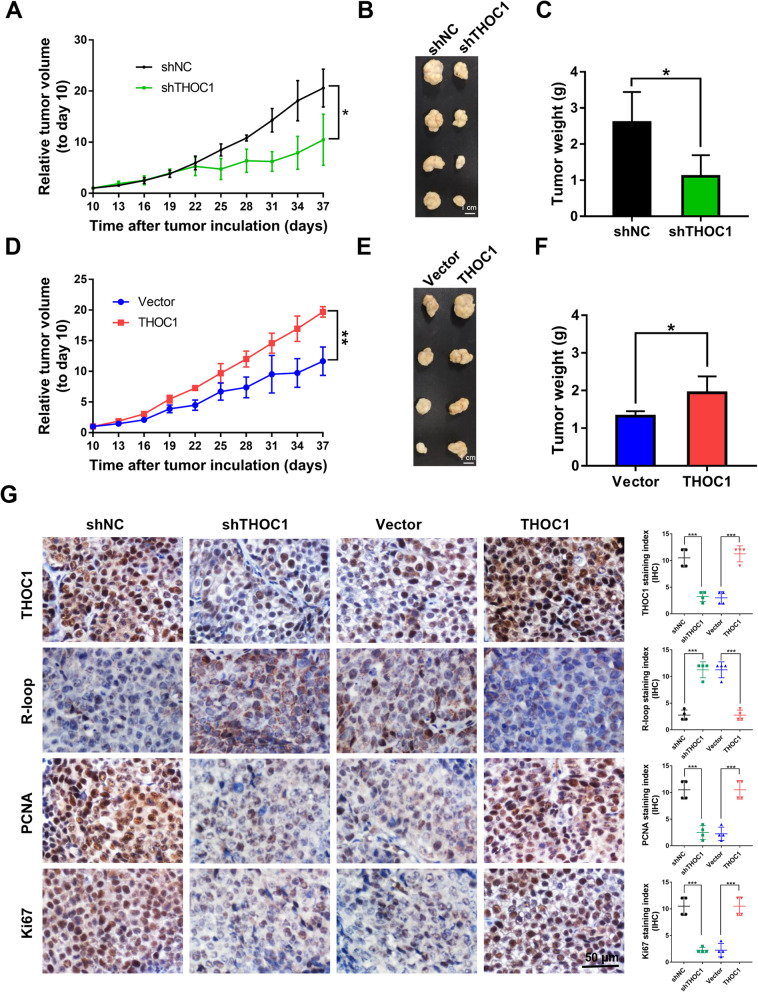
Fig. 4.
THOC1 enhances tumorigenesis in vivo. a Relative tumor volume, (b) images of tumor, and (c) tumor weight of PLC/PRF/5 stably transfected with shNC or shTHOC1 plasmids in BALB/c nu/nu mice (Student’s t test; *P < 0.05). d Relative tumor volume, (e) images of tumor, and (f) tumor weight of THOC1-expressing HepG2 cells in nude mice were compared with those of the control vector-transfected HepG2 cells (Student’s t test; *P < 0.05, **P < 0.01). g THOC1 protein expression in subcutaneous xenografts was determined by immunohistochemistry. R-loop level was estimated by S9.6 staining, and cell proliferative activity was measured by PCNA and Ki67 staining (Student’s t test; ***P < 0.001). Scale bar, 50 μm

