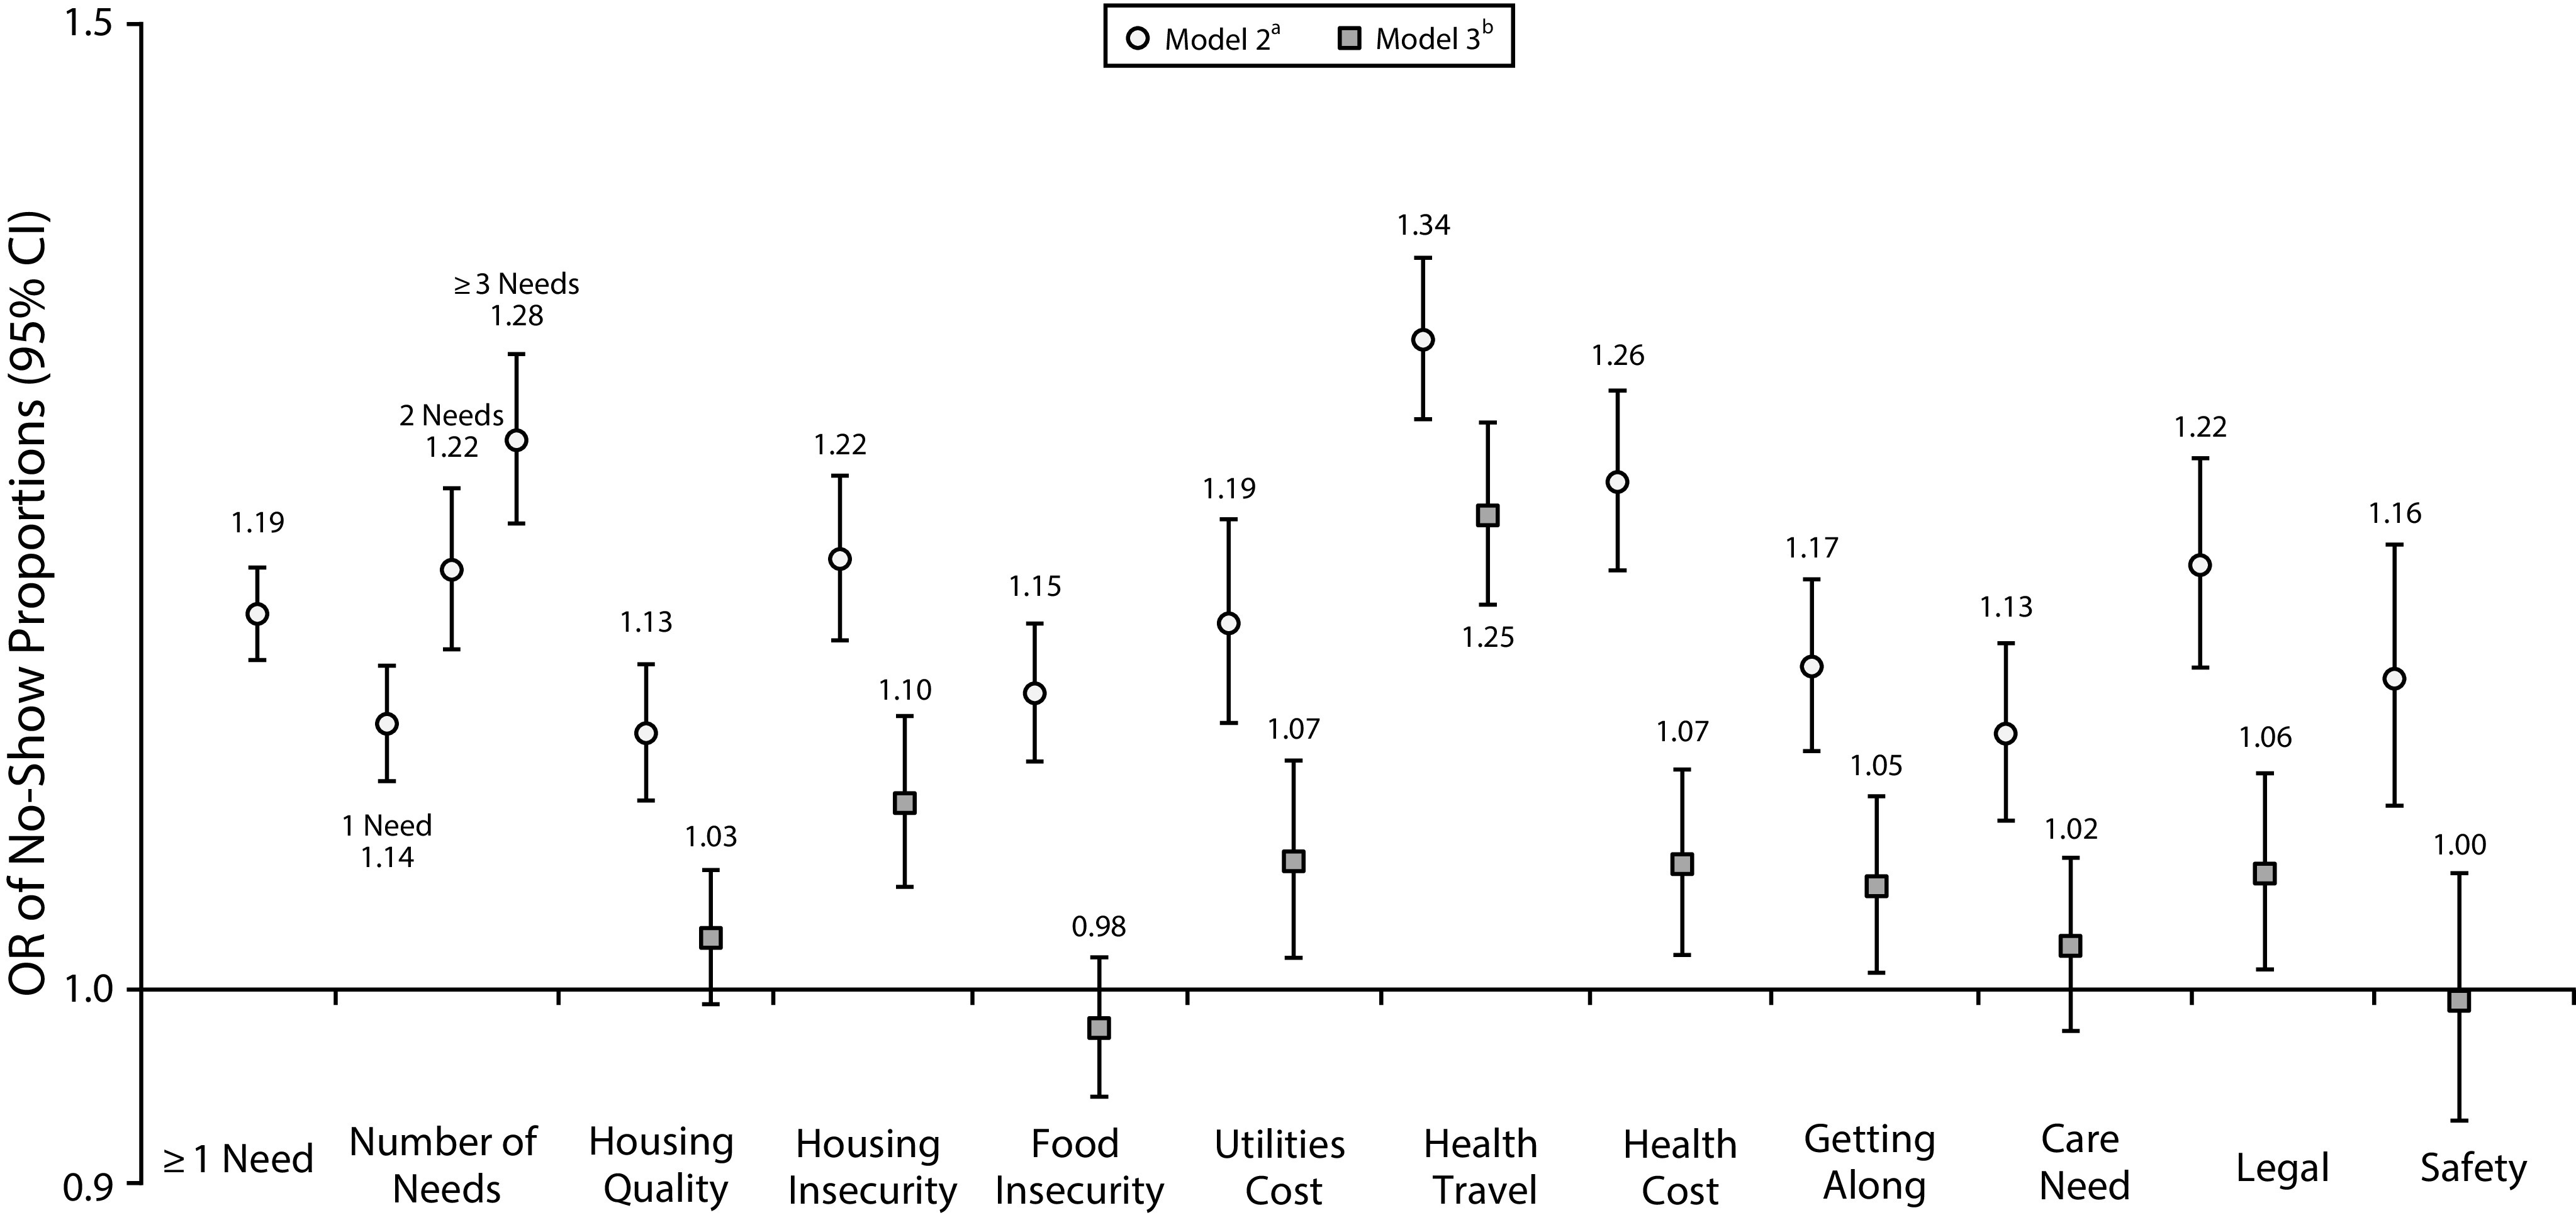
FIGURE 1—

No-Show Primary Care Proportion Ratios Comparing No Social Risks to One or More, Increasing Number of Needs, and Specific Social Risk Categories for Patients at an Urban Health System: Bronx, NY, April 2018–July 2019
Note. CI = confidence interval; OR = odds ratio. The ratio of no-show proportions was estimated with a Poisson model.
aModel 2 adjusted for age, sex, race/ethnicity, preferred language, payer, area-based poverty, public housing status, and Elixhauser comorbidity score.
bModel 3 adjusted for each social need plus model 2 covariates.
