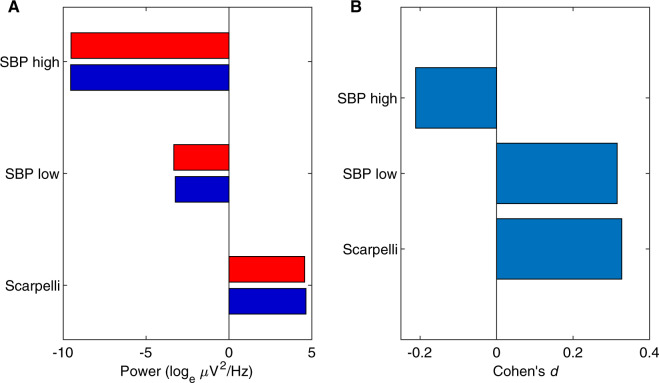
Figure 8.
Step 5 blind classification results. (A) The difference in feature means between Cluster 1 and Cluster 2. Cluster 1 in dark blue bars and Cluster 2 in bright red. (B) The effect sizes of the difference in A, of Cluster 1 from Cluster 2 in Cohen’s d, after subtracting each participant’s means.

