
Figure 1.
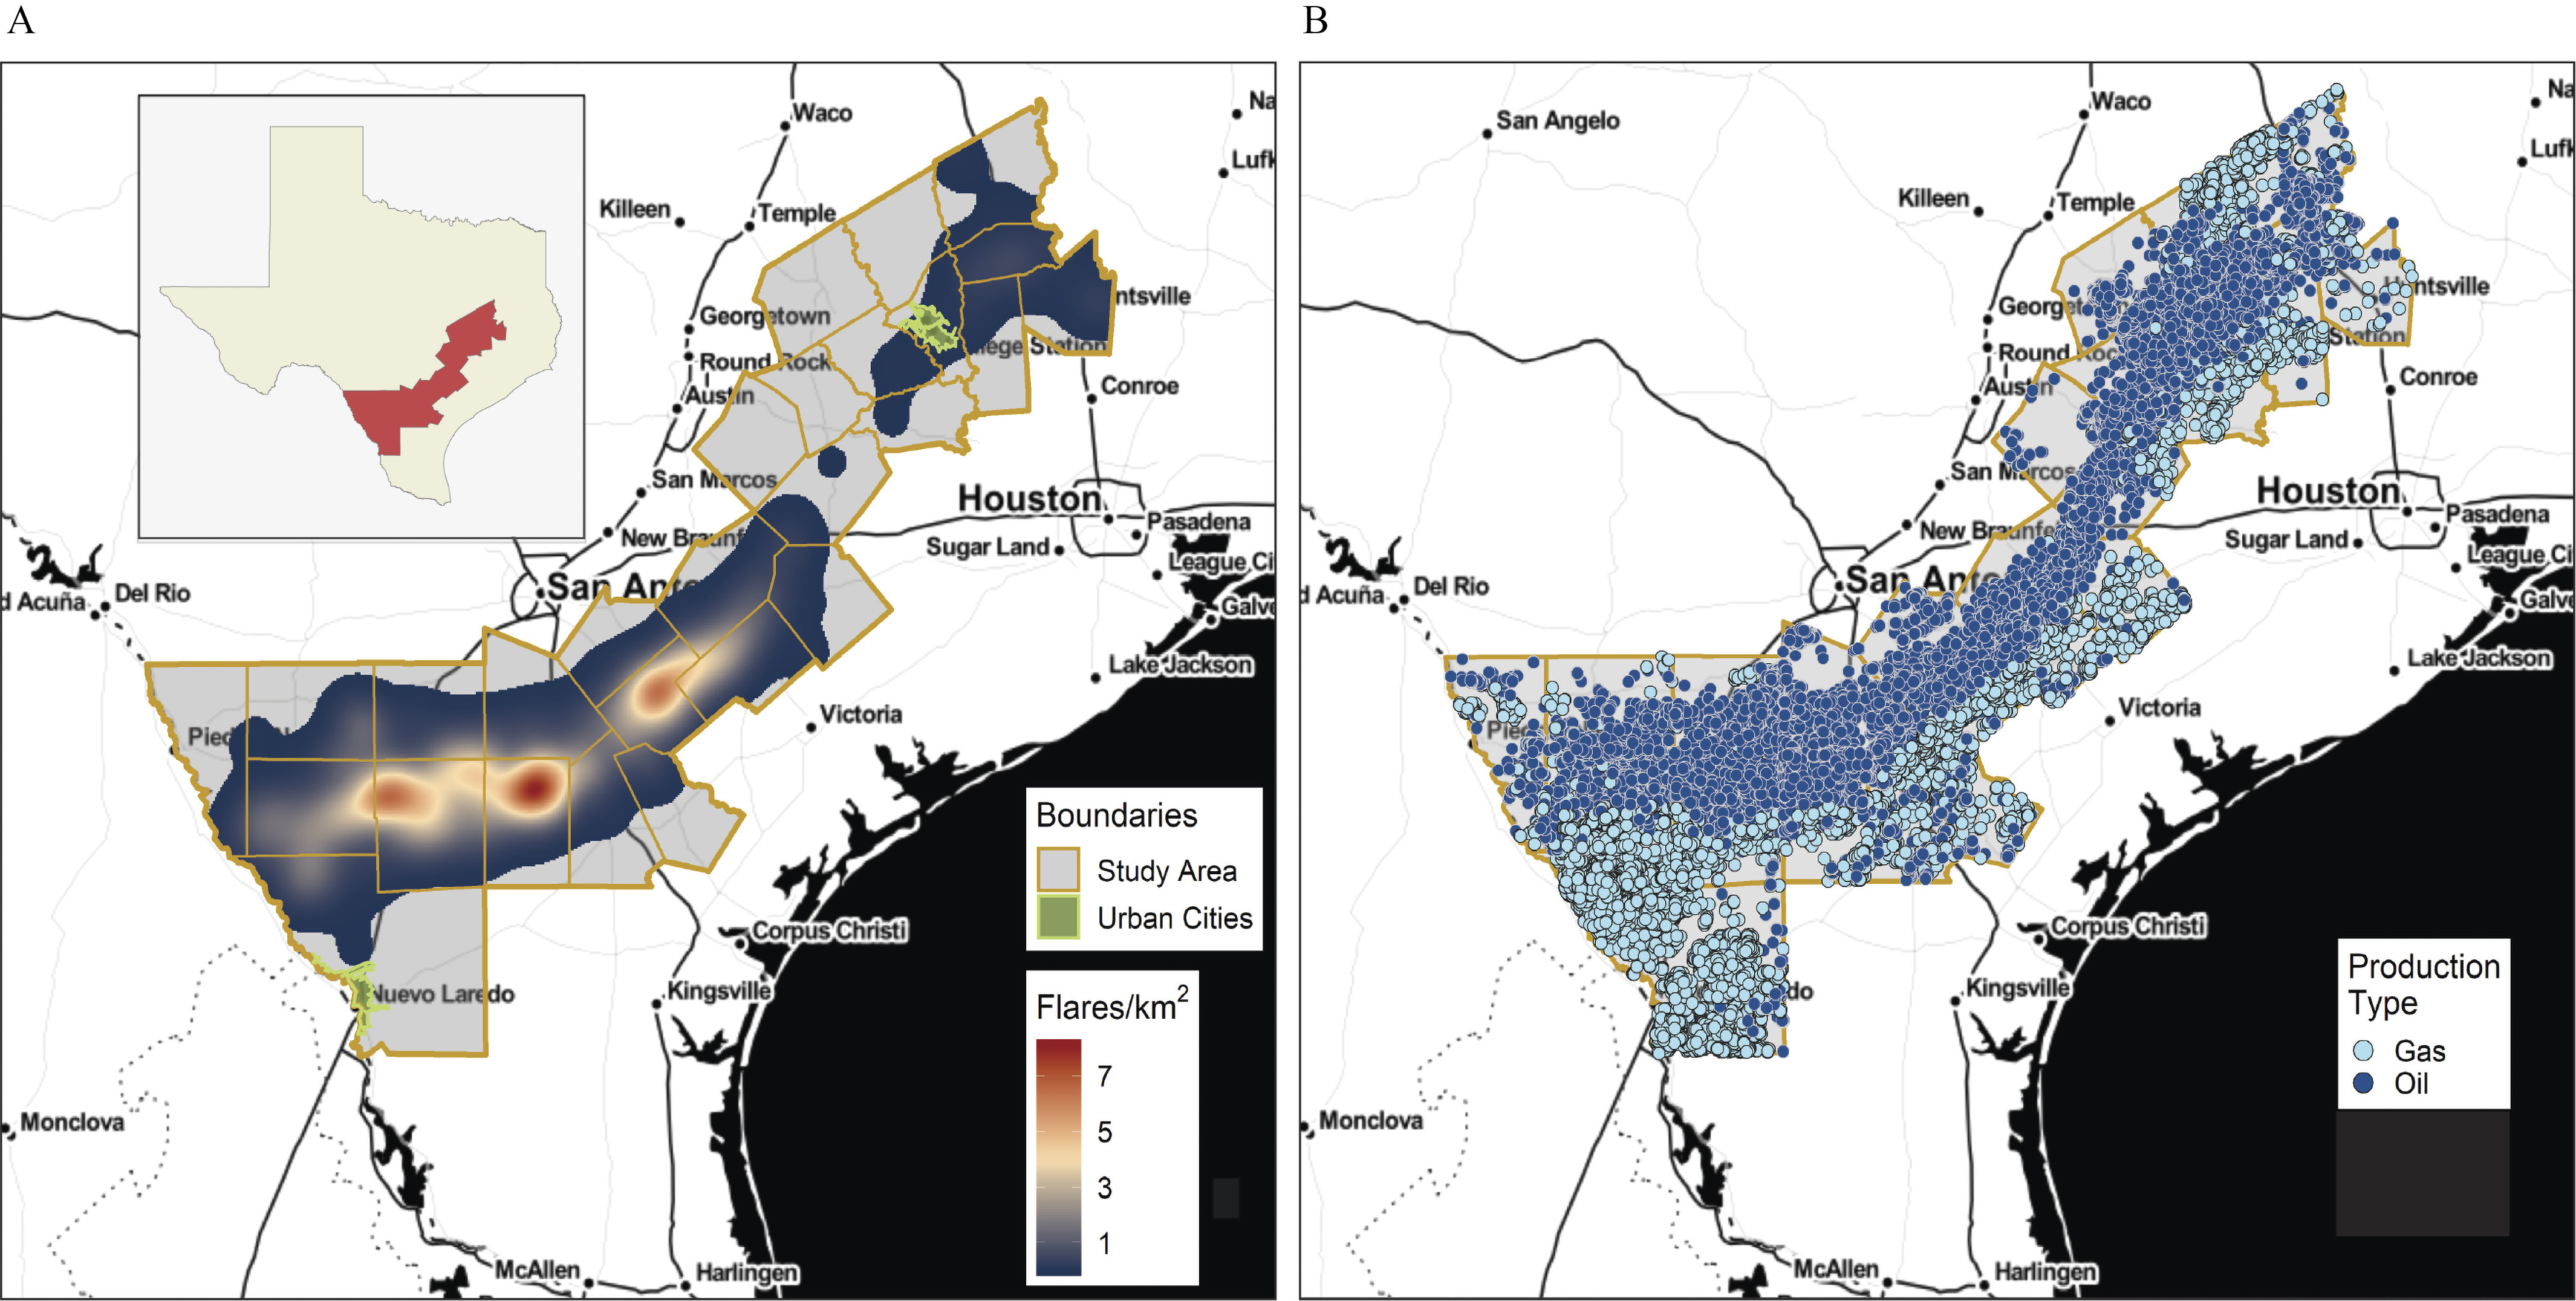
Density of (A) nightly flare events and (B) oil and gas wells across the 27-county Eagle Ford study area, excluding urban areas. Data sources: VIIRS Nightfire (https://www.ngdc.noaa.gov/eog/viirs/) and DrillingInfo (2018) (now Enverus). Counties are delineated in yellow. Green boundaries delineate cities with more than 75,000 people, which were excluded from the analysis. Note: VIIRS, Visible Infrared Imaging Radiometer Suite.