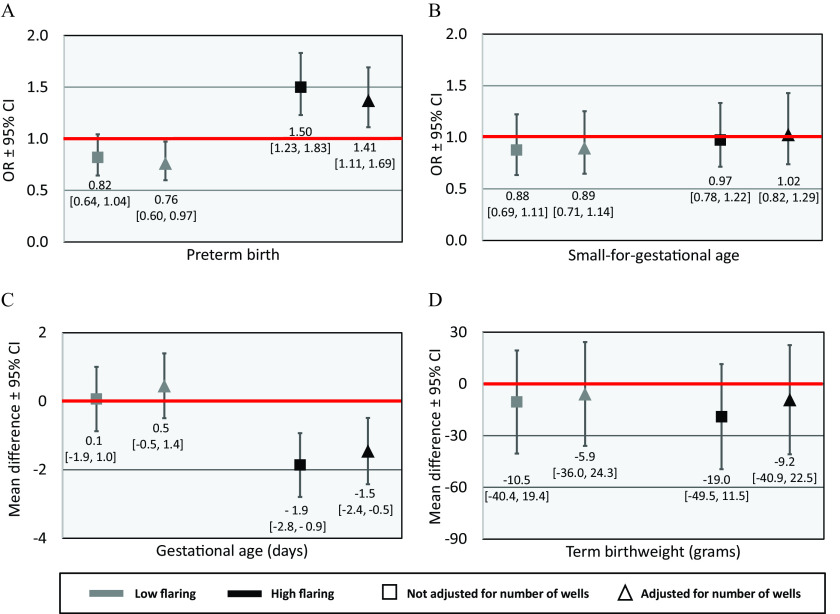
Figure 2.
Estimated associations between the number of flares within of maternal residence and (A) the odds of preterm birth, (B) the odds of small-for-gestational age birth, (C) gestational age, and (D) term birthweight, Eagle Ford Shale, Texas, 2012–2015 (). Full numeric data for models that are unadjusted (Model 1) and adjusted (Model 2) for the number of oil and gas wells within are provided in Tables S2 and S3. Figures show effect estimate and 95% CIs comparing infants with prenatal exposure to a low (1–9) and high (10–562) number of nightly flare events within of the maternal residence to unexposed infants. All estimates are adjusted for maternal age, race/ethnicity, nativity, education, prepregnancy BMI, smoking, insurance, parity, high-risk pregnancy, infant sex, prenatal care, year of birth, and season of birth. Models of term birthweight additionally controlled for gestational age. Red lines indicate the null. Note: BMI, body mass index; CI, confidence interval; OR, odds ratio.

