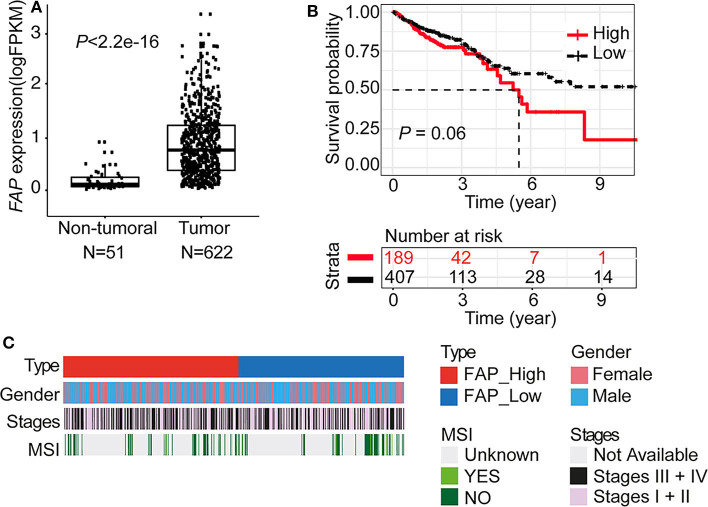
Figure 2.
FAP is upregulated in colorectal tumors. (A) FAP expression level in tumors (n = 622) compared to non-tumoral tissue (n = 51) in the TCGA data set. (B) Overall survival analysis (Kaplan–Meier) of CRC patients from the TCGA data set stratified by FAP expression (see also Supplementary Figure 2). (C) Colorectal cancer patient characteristics grouped by FAP expression. Statistical comparisons of clinical and molecular parameters between tumors with high vs. low FAP expression are shown in Table 2. Statistical comparisons were performed Mann–Whitney U-test in (A) and by log-rank test in (B).

