Figure 1.

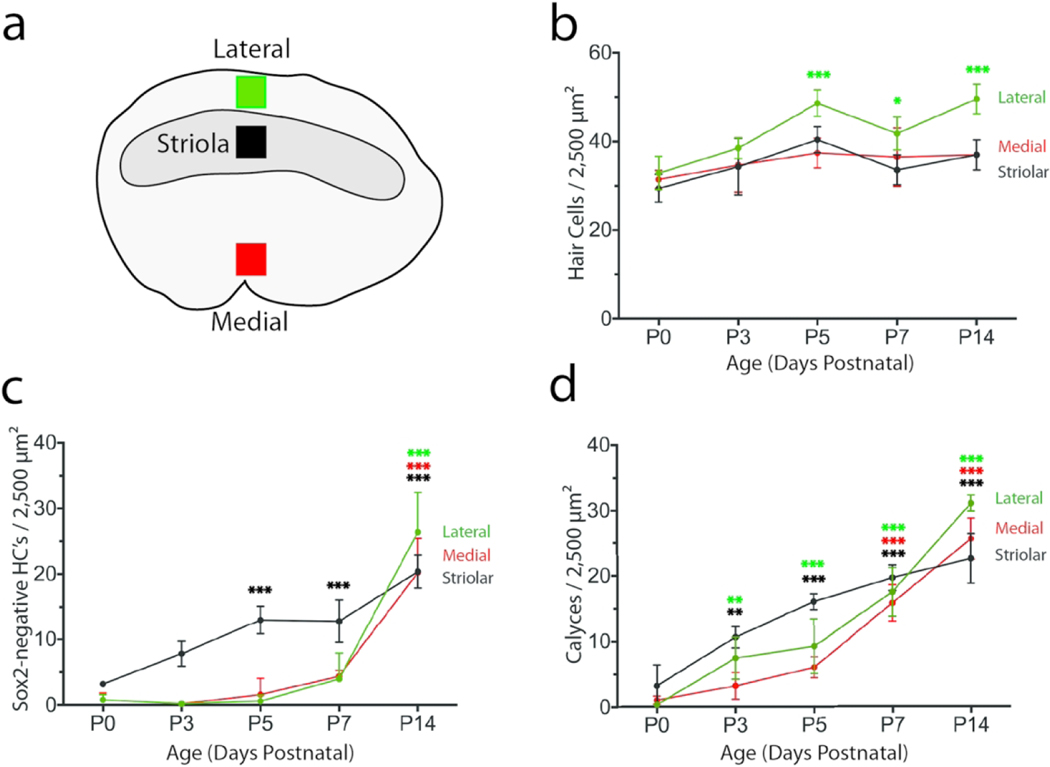
Quantitative data on utricular hair cell density, Sox2 expression, and calyx formation during neonatal development. Specimens were fixed at P0, P3, P5, P7, and P14 (n = 4–5 mice/time point) and processed for immunolabeling of hair cells, neural calyces, and Sox2 expression. All data were obtained from 50 × 50 μm regions within the lateral extrastriolar, striolar, and medial extrastriolar regions of each utricle. (a) Locations of the sampled regions, which were situated along an axis approximately midway between the anterior and posterior poles of the utricle. (b) Hair cell density as a function of postnatal age. A small developmental increase in hair cell density was noted in the lateral region. (c): Density of Sox2-negative hair cells (presumptive Type I hair cells) as a function of age. At P0, Sox2-negative cells were mainly confined to the striolar region. Although the numbers of Sox2-negative hair cells in the extrastriolar regions showed a slight increase after P5, a statistically significant loss of Sox2 expression in extrastriolar hair cells (relative to P0) was not observed until P14. (d): Density of calyx nerve terminals as a function of age. A few calyces were observed in the striola at P0. Extrastriolar calyces were first noted at P3. Calyx numbers in all regions continued to increase through P14. The increase in calyx numbers, along with the concomitant loss of Sox2 expression in hair cells, likely reflects the maturation of Type I hair cells. Data are expressed as mean ± SD. Statistical tests used two-way ANOVA followed by a Tukey’s post hoc test to determine significance between P0 and all subsequent time points (*p < 0.05, **p < 0.01, ***p < 0.001)
