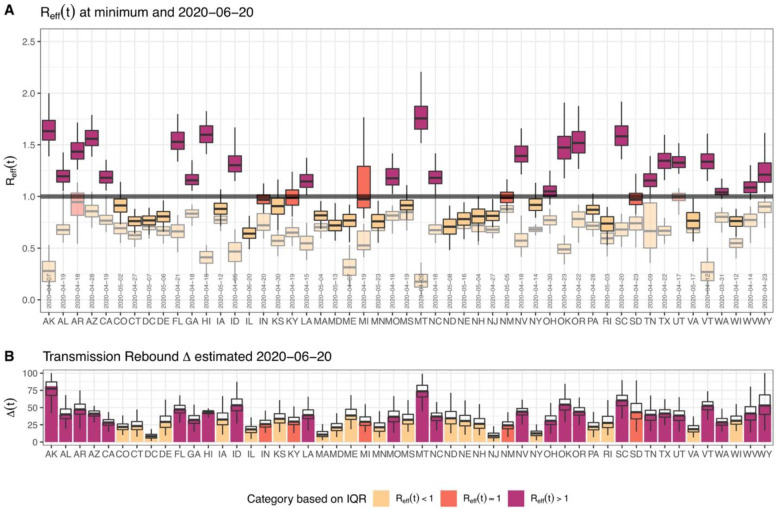
Figure 2.
Estimated effective reproduction number Reff and the level of reopening/rebound in transmission as of June 20th, 2020 for all states. (A) shows estimated Reff (median, IQR, and 95% CrI) across States. The figure shows that “now” (value on June 20th, 2020) and the “minimum” (between March 19th, 2020 and June 20th, 2020) in lighter shades of each color. It also includes the date of the minimum Reff. (B) shows the level of reopening/rebound in disease transmission in each state relative to its minimum value during state shelter-in-place (median, IQR, and 95% CrI).

